VLCC segment breaks out of rut as higher employment in
summer buoys earnings
More VLCCs managed to secure employment in August, as higher
demand for crude spurred by stronger refinery processing and robust
refined products cracks in the Atlantic Basin boosted utilization
rates significantly.
Demand for shipping crude oil increased, due to more cargoes
traded and longer distances covered.

Data by S&P Global Commodities at
Sea show VLCC tonne-miles increased by 4.8% on month and 6.8%
on year. This has been the highest employment achieved so far this
year.
The increase in demand has been reflected both in terms of
rising number of fixtures in the spot market and tighter
availability of open ships.
The availability of open vessels was also reduced in the Middle
East Gulf and other major exporting regions.
European importers have been switching away from Russian
shipments, which have been sustained, but have moved more toward
India and China, adding to the tanker shipping demand. Suezmaxes
and Aframaxes have been employed in these flows, but there has been
a spillover effect for VLCCs, since the competition elsewhere
coming from smaller tanker segments to chase the same crude cargo
has declined sharply.
To understand the actual spot availability, it is worth
mentioning that a significant portion of the older fleet of VLCCs
believed to be involved in illicit trades and undertaking dark
activity has recently seen changes in ownership.
Prices for ageing tankers – approaching 15 years old – have
increased, as several investors show increased interest in amassing
fleets to carry Russian crude oil to Asia. The price of 10-year-old
VLCCs is understood to have increased by more than 20% in recent
months.
However, one potential outcome of sanctions on Iran being eased,
would be that the global fleet of older tankers increases as the
vessels that used to transport sanctioned crude now return to the
market, pushing more tonnage to demolition.
With more VLCCs staying employed and for longer, the number of
ballast ships has quickly declined.

The spread between ballast and laden units has improved from an
average of -147 in June (the ballast fleet exceeded the number of
laden units by 147) to an average of -106 units in August and close
to -70 going into early September.
This figure has been fluctuating between -106 and -147 earlier
this year, with an average of -127 in H1 2022.
Last year’s levels suggest a much healthier market, with an
average spread of -100 ships in 2021.
The market last experienced positive figures between April 2020
and June 2020, with the average of Q2 2020 at 40 units. This was
driven by the immediate shock following the spread of Covid-19,
which led to huge demand for floating storage. The market then
slowly returned back to normal levels.
Laden VLCCs now represent more than 45% of the total fleet
globally, an unprecedented level since since early H2 2020.

Laden VLCCs west of Suez surpassed 80 units in late August, with
an average of 74 for the month. This is the highest achieved since
July 2020.
Crude exports on VLCCs from the USGC stood near 2.1 million b/d
in August, versus less than 1.5 million b/d in H1 2022. Demand for
U.S. barrels has been improving since Q2 2022, with West Texas
Intermediate’s discount to international benchmarks making U.S.
exports much more popular, both in Asia and Europe.
Meanwhile, the number of laden VLCCs positioned east of Suez
have increased as well, surpassing 290 units in late August, with
an average of 286 during the month. This is an increase of 4.3%
from July, 5.1% up from Q2 2022 and 2.5% up from August 2021.
Monthly increases in OPEC’s crude oil production and exports
have boosted spot cargoes to be lifted from the Middle East Gulf,
requiring 168 VLCCs to load in August 2022, versus levels typically
below 140 units.

The increased demand, in combination with higher average spot
tanker freight rates and lower bunker prices, have allowed some
owners to marginally increase their average laden vessel speeds,
according to Commodities at Sea.
The average speed of laden VLCCs surpassed 12 knots in August,
after remaining below these levels in June and July 2022.
There has also been a slight uptick in ballasters’ average
speeds in August.
These conditions have allowed VLCC operators to successfully
negotiate higher rates, especially as other operating expenses,
such as insurance, have increased.
After suffering due to unprofitable freight rates for almost
seven quarters, the VLCC segment experienced one of the strongest
months in August, with average TCE for a typical non-eco and non
scrubber-fitted ship, taking into consideration various routes,
surpassing $40,000 per day. Freight rates were supported by lower
bunker prices, but most notably by higher demand to lift crude oil
from the Middle East Gulf, heading to the Far East. Meanwhile
altered trade flows around the world, following the Russian
invasion of Ukraine, have been creating new opportunities for the
segment.
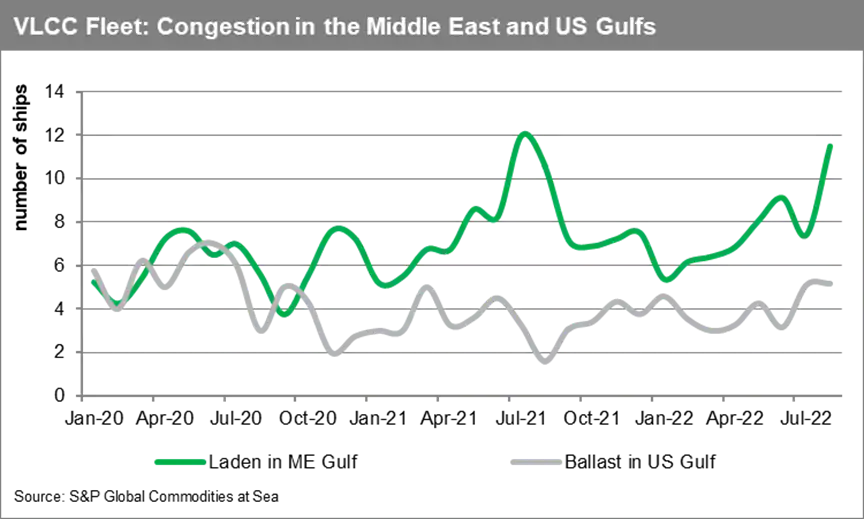
Data by Commodities at Sea suggest that
an average 12 laden VLCCs were positioned in the Middle East Gulf
on a daily basis throughout August, the highest since July 2021.
The increased activity has added to the operational delays observed
in the region.
There are also more ballast VLCCs in the US Gulf, near exporting
U.S. ports. Wait times have increased due to rising cargoes to be
lifted. These typically require STS activity on Aframaxes. On
average, there have been more than five ballast VLCCs daily,
throughout July and August, waiting to load in the region. These
levels haven’t been observed since March 2021, while we’d need to
go further back, to June and July 2020, for the figures to be
maintained above these levels for two consecutive months.
The Platts benchmark VLCC freight rate for Middle East Gulf to
China (270,000 mt of crude) has been assessed near w80, or
$16.5/mt, for most of the second half of August, the highest since
late March 2020, when the crude market was still in contango,
motivating charterers to employ larger vessels for floating
storage, after global demand collapsed due to the pandemic.
The outlook for winter demand remains unclear, given ongoing
macro weakness in China. Crude buying would have typically
accelerated in the second half for the new year but given the
current demand landscape, refinery runs as well as crude imports
may only pick up slightly going into 2023.
Meanwhile OPEC+ has now reversed course and cut target
production starting October, although the ongoing war in Ukraine
has disrupted traditional crude oil flows and provided owners with
new opportunities for employment.
No real revival for VLCC newbuilding orders
After a rather long break — with no newbuild VLCC orders placed
in H1 this year — Japan’s Mitsui OSK Lines decided to order the
construction of two LNG dual-fuelled units, scheduled to be
delivered in 2025 and 2026. This was to secure replacements for two
of its ageing VLCCs, rather than expanding its fleet capacity.
Moreover, this allows the company to deploy some capex and reduce
its income tax burden.
However, this is likely a one off rather than reflection of a
wider trend, despite recent recovery in VLCC profitability.
Newbuilding prices that shipyards currently command are not
attractive enough for new orders to take place. South Korean
shipbuilders target deals near $140 million for the construction of
a VLCC newbuilding, which is currently at the highest level in over
a decade. The cost of construction for a VLCC is estimated to
exceed $120 million to $130 million, with dual-fuel capability
options increasing the pricetag by another $10 million to $15
million per unit.
Competition for yards from other shipping sectors, such as
container ships, remains high, driven by the historical high profit
margins. Interest across VLCC owners remains limited if any, with
not many enquiries for more newbuildings.
The VLCC segment is believed to be placed well enough to deal
with any potential global recession, mainly due to a much lower
orderbook, which now represents less than 5% of the fleet (near
historical lowest levels). During previous global recessions
suffered since the 1990’s, the orderbook was between 12% and 50% of
the trading fleet. The extreme high was observed just before the
2008-crisis. The figure stood near 8% when Covid hit in early
2020.
For more insight subscribe to our
complimentary commodity analytics newsletter
This article was published by S&P Global Market Intelligence and not by S&P Global Ratings, which is a separately managed division of S&P Global.