Based on insights from Windward’s AI-powered ocean freight visibility solution, and freight data from Freightos’ Baltic Index, both companies partnered to better understand the impact of current trends on the China-US flow of goods, port congestion in both countries, ocean freightprices, and what is driving these changes.
June TEU capacity increasing in the China-US corridor
According to Windward’s insights from March-June 2022, container vessels undertook 800 voyages to US ports following a stop in China, representing a capacity for 4 million twenty-foot equivalent units (TEUs).
A year-on-year comparison of March-June 2022 against those same months last year shows a drop in both the number of vessels and the TEU capacity from Chinese to American ports in June 2022 compared to both the previous month and the previous year.
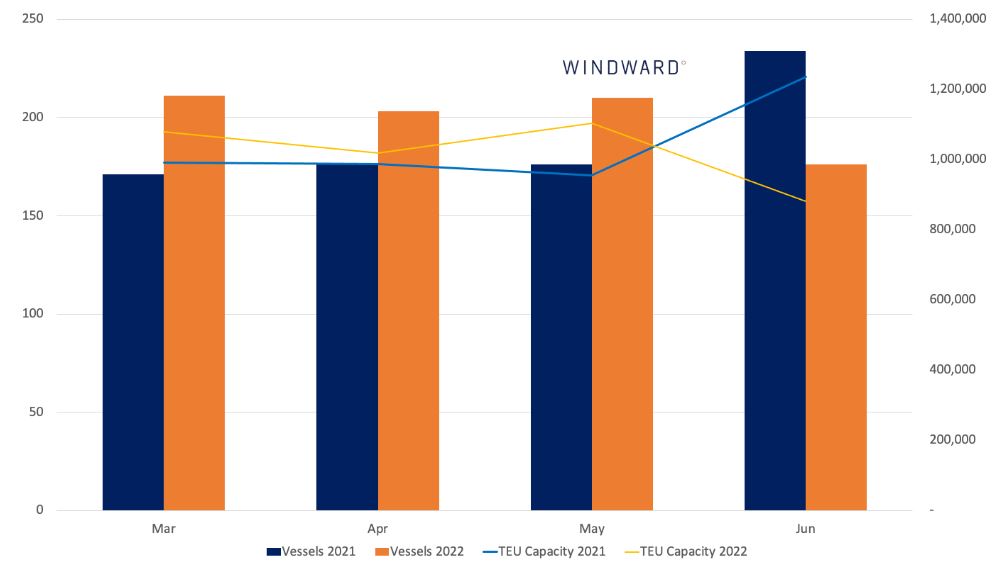
Current data shows a significant drop in June 2022, but may not yet depict the whole story.
However, the current data is unlikely to provide a complete picture.
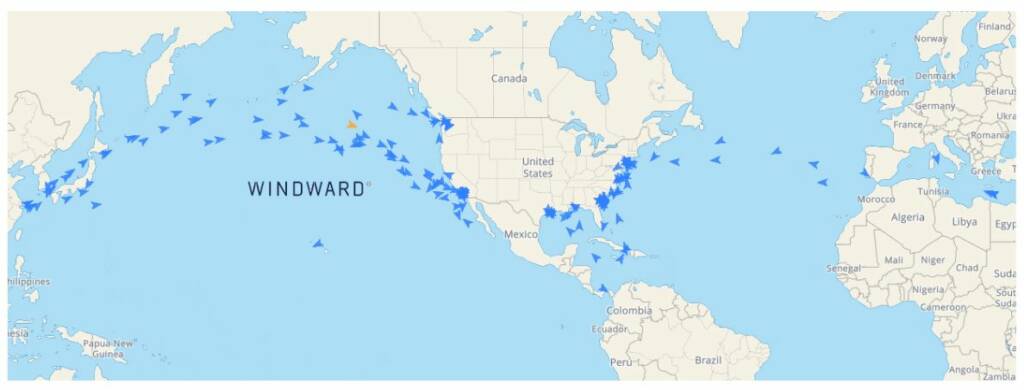
While the analysis includes 212 container vessels currently en route to a US port, there will be vessels that left China in June 2022 bound for a US port that have yet to announce which US port is their next port of call.
This happens because the vessel has other ports on its schedule before the US, or because they are waiting to be closer to the port before calling it.
Either way, they are not represented in the current 2022 numbers.
In 2021, 12% of vessels that left China in March-June made it to US ports between August and September.
If the same pattern was to repeat this year, vessels with an additional 550,000 total TEU capacity will arrive at US ports in the coming weeks.
This would bring the total TEU capacity for June to 1.4 million and would represent an increase of 30% in TEU capacity compared to May.
Even if only half of those vessels are still on their way to the US, it would mark a 5% increase in June compared to May, and a 2% increase year-over-year for the entire period.
What is happening at Chinese ports and how does that compare to US ports?
Globally, we find that one in every five (21.4%) containers that passed through a port somewhere in the world also passed through a Chinese port.
Container vessels that docked in Chinese ports during June carried a combined 18.7 million TEU capacity. For comparison, vessels in US ports during that time had a combined capacity of 5.9 million TEUs.
This means that for every three containers that passed through ports in China, only one passed through a port in the US.
US port congestion overview in June
Windward is seeing less traffic in some parts of the West Coast of the US.
The city of Oakland decreased its average port call length by 14.5% in June (month over month).
Long Beach stood at a remarkably high 84 hours in June, which is more than 2.5 times longer than the global average, explaining why the port only handled 75 container vessel port calls that month.
At the same time, New York’s average port call length for container vessels rose from 42.6 hours in May to 45.2 hours in June, more than double the average for the top 10 ports.
Southeast, Port Everglades in Florida, increased its port call length by 19.5% compared to May, bringing its average to 20 hours per container vessel.
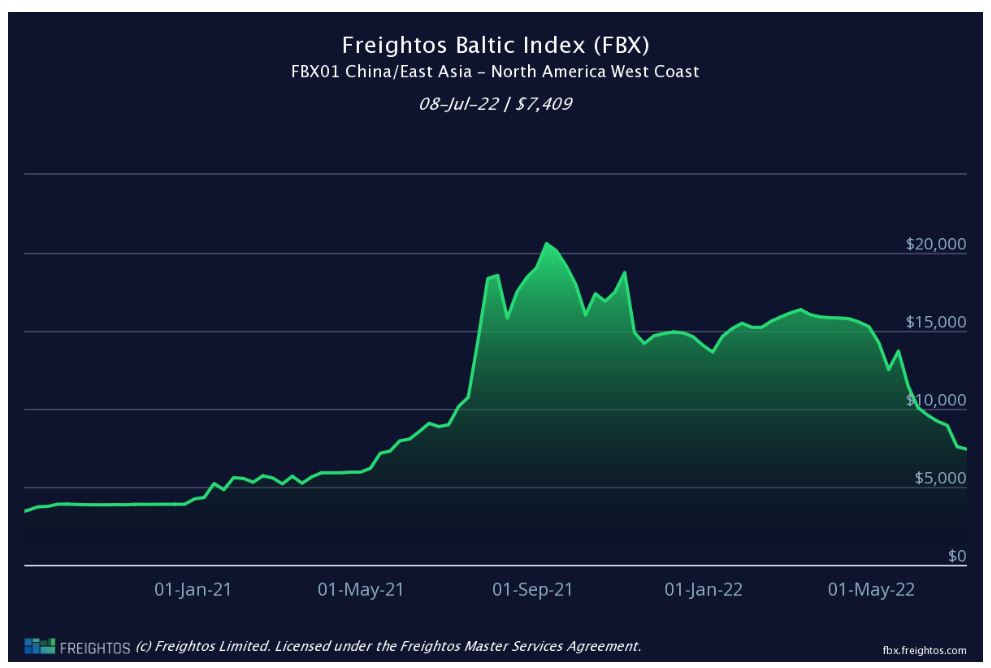
Freight rates continue to fall
Freightos Baltic Index data shows that the current spot rate of $7,326 per 40-foot container on the Asia-US West Coast lane is less than half of the rate from the last week of April.
The TEU data above suggests that capacity was fairly stable in April and May.
One driver of the 34% rate decrease in May during the shutdown could have been the lack of available exports, as manufacturing and trucking were extremely constrained.
A drop in underlying demand – despite Shanghai reopening and capacity decreasing – is likely the cause of falling rates in June and July.
The fact that this year’s prices continue to fall during the same months that they were beginning an 80% climb last year, suggests that different underlying market conditions are at play in 2022.
The size of this rate drop may be amplified because many shippers had already started pulling peak season orders before (or during) the shutdown in an attempt to stay ahead of the supply chain challenges of previous years.
As underlying consumer demand decreased, however, many importers may have found themselves carrying enough inventory for the upcoming shopping seasons, resulting in a drop in demand for ocean freight.
A survey of small and medium importers on the freightos.com marketplace in early June reflected these trends.
More than half of the respondents reported that they had already placed peak season orders early in the hopes of building inventory.
A further two-thirds said they were already experiencing a decrease in demand for their products, with 84% of those attributing that dip to inflation.
One thing is certain: change is coming.
Freight forwarders and beneficial cargo owners may want to consider technology that would help them stay on top of changing freight rates and obtain better ocean freight visibility.
Read the latest issue of Trade Finance Talks, July 2022