KanawatTH/iStock via Getty Images
Written by Nick Ackerman, co-produced by Stanford Chemist. This article was originally posted to members of the CEF/ETF Income Laboratory on March 17th, 2022.
LMP Capital and Income Fund (NYSE:SCD) has been a fund I’ve been keeping on my radar. The unique exposure to the way it invests should generally provide a varied outcome relative to something like the S&P 500. So far, that is what we’ve been seeing play out this year, as the S&P 500 SPDR (SPY) fund has sunk further than SCD. The fund’s overweight exposure to tech has been a meaningful detractor on the fund – though it has really been every sector but energy that has contributed to this, to be fair.
At the same time, we have seen the usual closed-end fund share price action that we often see in sell-offs; that is, the share price falls further than the actual NAV. SCD’s performance has been a bit closer than some other funds that we’ve been covering lately but still seeing a similar pattern nonetheless.
This is often when the strongest opportunities are made in investing in CEFs. It is at those times when you feel that you never want to touch another CEF again because “all they do is decline further!” That’s the leverage and discount widening impact that we are seeing. It happens every time.
Below is the YTD performance of SCD relative to SPY to provide some context.
Ycharts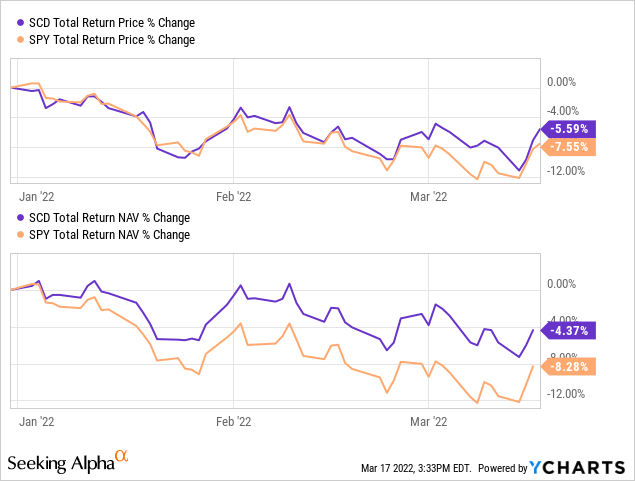
The more challenging question to answer is always when we get the rebound. That’s one that I can’t answer, just that CEFs are definitely looking much better than they were at the tail-end of 2021.
The Basics
- 1-Year Z-score: -0.41
- Discount: 10.35%
- Distribution Yield: 7.37%
- Expense Ratio: 1.16%
- Leverage: 17.40%
- Managed Assets: $350.67 million
- Structure: Perpetual
SCD provides “a broad-based portfolio that can invest in a range of equity, and fixed-income securities of both U.S. and foreign issuers, including MLPs, stocks, REITs and fixed income.” The fund will seek “total return, emphasizing income.”
With this flexible approach, that is how we end up with a unique portfolio spread across various asset classes, which is precisely what we have got with this fund. They also mention that it “invests using a rigorous, research process to identify companies with strong fundamentals, skilled and committed management teams and a clear market advantage.”
What is interesting here is the sizeable allocation they choose to allocate to MLP holdings. At the same time, with the emphasis on income, MLPs can be a great fit for such a fund. The more unusual in that case could be considered the tech allocation, which is where most other “diversified” funds invest heavily.
The fund is a bit smaller, which could mean a lack of liquidity for larger investors. They utilize a moderate amount of leverage, which seems prudent given the underlying tech and MLP exposure that can cause quite a bit of volatility.
The fund’s expense ratio comes to 1.16%; it comes to 1.33% when including leverage. The loan that they have outstanding will be impacted negatively by higher interest rates since it is a floating rate calculation. In this case, as of May 27th, 2021, the fund amended its credit agreement. Effective June 20th, 2021, the fund pays a borrowing rate based on “Overnight Bank Funding Rate plus applicable margin.” At the end of their fiscal year, November 30th, 2021, that worked out to an average interest rate of 0.79%.
Performance – Long-Term Results Not Overly Impressive
Given the higher exposure to MLPs and financial sectors, it hasn’t been able to provide similar long-term returns in the double-digits that many other heavier equity-based funds have been able to achieve. At the same time, as we showed above, the fund is also holding up a bit better at this time when the broader markets are falling further. I think that’s a fairly good sign of a fund that could provide diversification for investors. The fund also holds a fairly meaningful allocation to convertible preferred stock.
Due to the heavier tech exposure – which they have upped since we last looked at the fund – we are still getting fairly respectable returns. The fund also launched at the beginning of 2004, which means it has survived two massive market drops now.
SCD Annualized Returns (Franklin Templeton)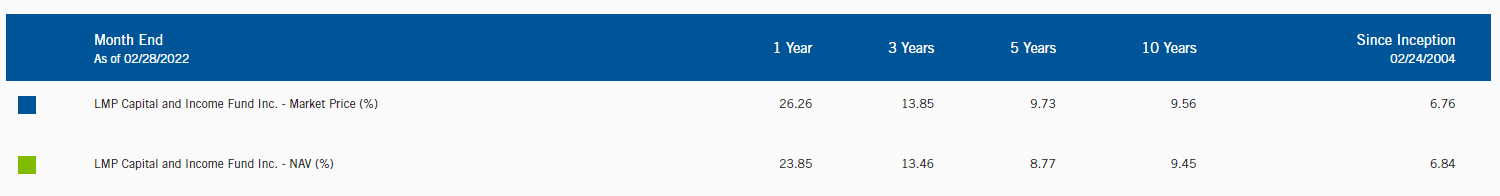
What is a bit more interesting for this fund is the current discount. It is at a double-digit discount, only a bit wider than where it started the year. Over the last year, we have seen an average discount of 9.87% compared to the 10.32% level we are seeing now. That puts the 1-year z-score at -0.41 – a somewhat attractive level but not a screaming deal.
What I find interesting about this, though, is the fact that it is almost right at its 10-year average discount. Given the considerable amount of volatility, that is a bit more unusual. However, we have seen the widening out of the discount since the start of the year.
This longer-term average implies the fund’s current discount has generally not gone wider than this but also hasn’t been more narrow. I would also note that this fund had only ever traded at a premium level once since it has existed, that was at its inception. Back in the day, CEFs would launch and the fees to launch a fund would be taken right out of the NAV. That resulted in CEFs trading at premiums immediately until the price inevitably fell shortly after launch.
Ycharts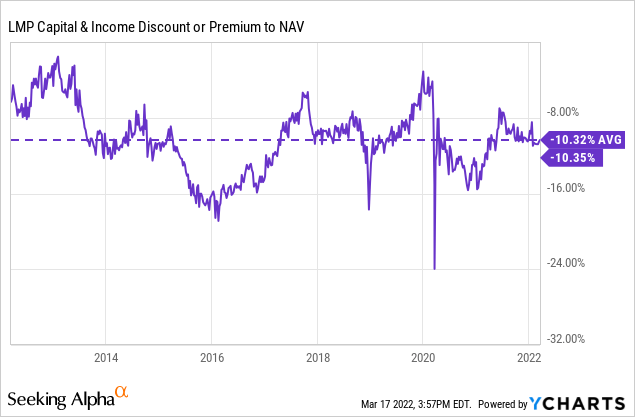
Distribution – Sustainable And Attractive Level
The fund originally launched with a monthly distribution but switched to a quarterly payout after the 2008/09 GFC. The current quarterly amount of $0.26 works out to a 7.37% distribution rate. At the same time, the NAV yield comes to 6.60%. Investors can receive a meaningfully larger distribution yield than the fund actually has to earn.
The latest quarterly amount was also a reduction from the previous pre-COVID quarterly payout. In total, they’ve cut the distribution twice since they’ve been around. For some, that’s two too many cuts, but for others, it could be considered fairly stable and predictable.
SCD Distribution History (CEFConnect)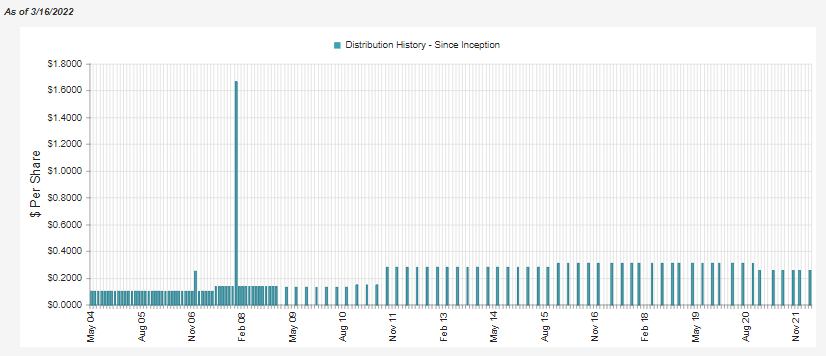
With the latest Annual Report, we can see that coverage of the fund is going to be reliant on capital gains to fund the payout. Net investment income actually fell year-over-year, but since that distribution cut in 2020, the total paid out has also fallen.
SCD Annual Report (Franklin Templeton)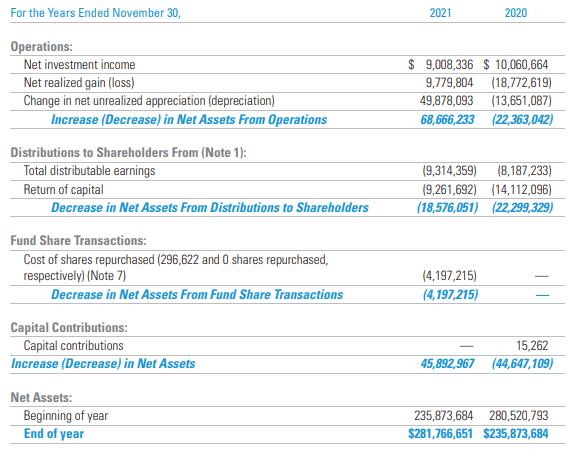
Due to these adjustments in both figures, NII coverage increased to 48.5% from the 45% level it was previously. Given the current distribution rate on NAV of 6.60%, it wouldn’t suggest that a cut is necessary at this time. However, a more prolonged down period could push them to have to trim again. In this case, it could come down to one’s view of the overall market going forward.
Due to their significant exposure to MLPs, we will see that the tax classification for their distribution contains a fairly large amount. As they outline in their latest report;
Distributions from net investment income by the Fund, if any, are declared and paid on a quarterly basis. The actual source of the Fund’s current fiscal year distributions may be from net investment income, return of capital or a combination of both. Shareholders will be informed of the tax characteristics of the distributions after the close of the fiscal year. The Fund intends to distribute all of its net investment income earned each quarter and any cash received during the quarter from its investments in MLPs and REITs. The Fund intends to distribute the cash received from MLPs and REITs even if all or a portion of that cash may represent a return of capital to the Fund. The Fund may distribute additional amounts if required under the income tax regulations
SCD Tax Classifications (Franklin Templeton)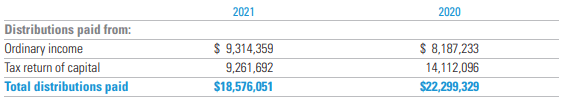
Return of capital will reduce an investor’s cost basis instead of being taxed immediately. That can be viewed as a positive for some investors. At the same time, some of this ROC has been destructive over the years and isn’t all associated with MLP distributions.
For 2021, we can see that NII and capital gains combined were enough to pay the current distribution. Not to mention the significant unrealized appreciation on top of that, the fund raked in. However, in 2020, we can see that they had undoubtedly fallen short.
SCD’s Portfolio
The fund isn’t necessarily the most active in its management. The fund last reported a turnover of 33%. In the previous fiscal year, a more significant 52% turnover rate was reported. Since I’ve been covering the fund, there has only been relatively subtle changes in the overall broader composition of the portfolio.
At this time, they have seemingly increased the tech exposure to the fund at the end of 2021. That is regarding where it was positioned at the end of September 2021. Unfortunately, that means they started to shift a bit early but were buying into a sector that had already sold off. With the power of hindsight, we can see that now. However, as we advance, this could still be a good thing to have a more reduced exposure to energy if an investor feels that energy has sort of run its course for 2022.
SCD Sector Allocation (Franklin Templeton)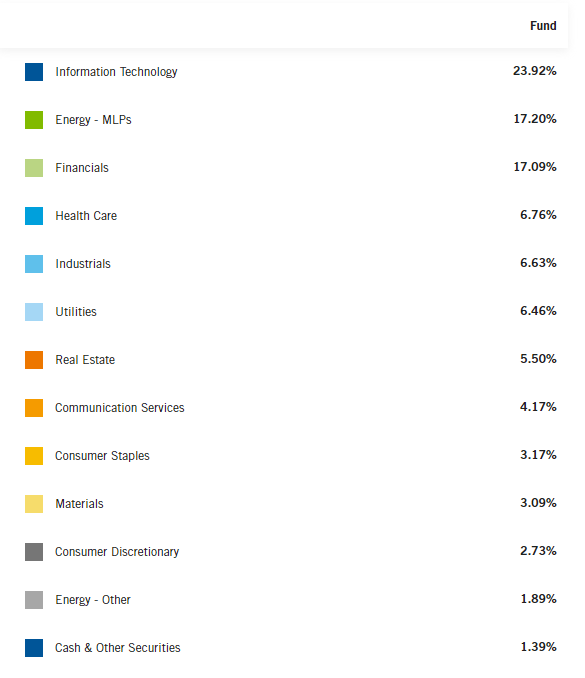
In our previous update, tech was 21.76%, energy was 20.91%, and financials were 17.06%. That shows the relative shift to a heavier tech weighting rather than energy. Considering it was the top-performing sector in 2021, it could have seemingly run its course, and that’s why the managers made such a shift.
At the end of 2021, the fund mainly carried common equity positions, but they lumped energy MLPs into their own category. The third-largest allocation was to convertible preferred stocks, which will generally follow the trading of the common equity from the issuing fund anyway due to the conversion feature.
SCD Asset Allocation (Franklin Templeton)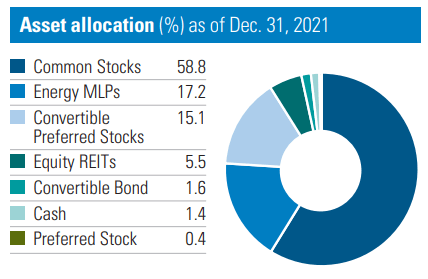
What we see here again is that MLP exposure was reduced from the previous update on SCD, and common stock positioning was increased. The convertible preferred stock was relatively unchanged at 15.61% in the last breakdown we looked at.
Looking at the fund’s top ten positions, we can see how diverse the fund is by noting the common tock, MLP and preferred stock holdings. We even see the JPMorgan 100% US Treasury Security (JTSXX) that they hold for their cash-like position. JTSXX should sound familiar as it made an appearance the last time we touched on the fund, which is exactly what I noted from the previous time we covered the fund as well. Their position in JTSXX has been reduced since the last time we touched on the fund.
The top ten make up a fairly large weighting of 33.45% at this time. It is also great that they share a more recent view of their holdings. This list was at the end of February 2022, rather than the end of 2021 in the weightings we looked at above.
SCD Top Ten (Franklin Templeton)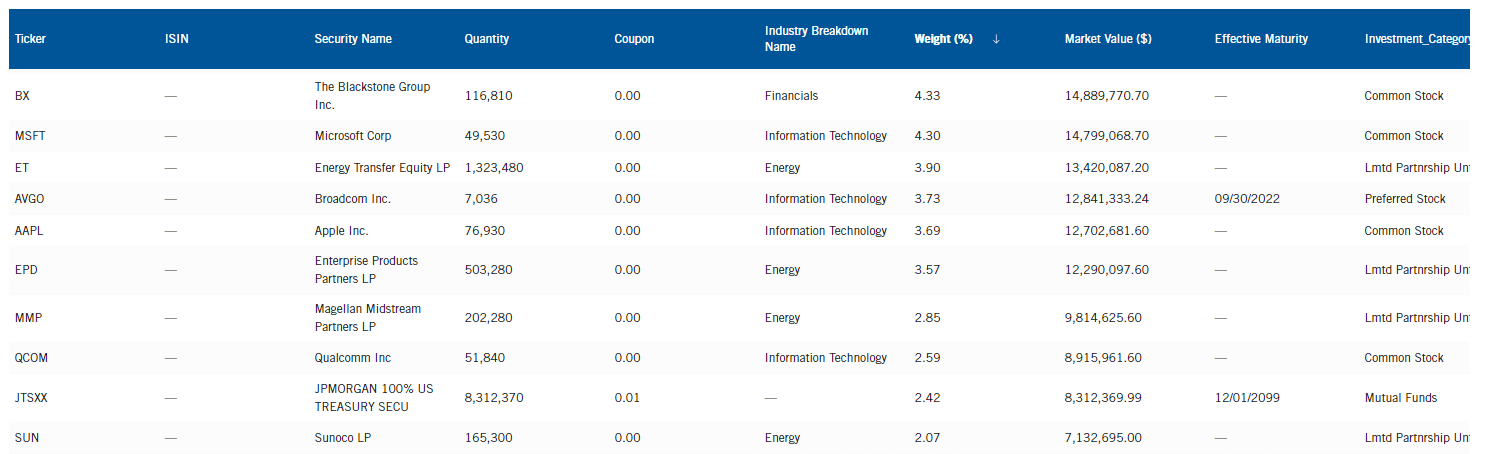
The latest position to take over the number one spot in the portfolio was Blackstone (BX) from Microsoft (MSFT). This came about as they have even reduced the total number of shares in both companies. At the end of September, they had held 51,430 shares of MSFT and 123,210 shares of BX.
Other reductions include their positions in Enterprise Products Partners (EPD) and Sunoco (SUN). Broadcom’s (AVGO) preferred issue and Qualcomm (QCOM) positions were also reduced in the number of shares being held.
Energy Transfer (ET) has moved up the fund’s top ten list as they increased the number of shares they held. Positions in Apple (AAPL) and Magellan Midstream Partners (MMP) were held flat since the last time we covered the fund.
Depending on the exact date of these changes – which we aren’t provided with – it would appear that it would have been a benefit to make such a change in the top three holdings. Tech was already beaten down at the end of 2021; it has only sunk further since. Though utilities and financials are making a strong effort to turn green for the year.
Ycharts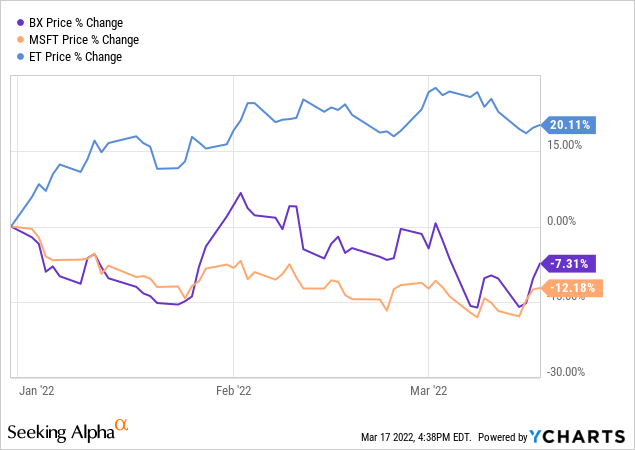
Conclusion
I’ve never made the jump into investing in this fund, but it continues to be one that I monitor for changes. Their unique approach is different from most other funds catches my interest. At the current discount, it could be argued that it is a fairly attractive buying opportunity. At the same time, I think that since it is right near its longer-term average discount that it isn’t necessarily making a case for a very strong buying opportunity. This discount for SCD has been much more persistent than most, especially over 2021, where discounts narrowed to historically narrow levels.