
We have recently looked at how ETFs work, as well as how retail trades and how much retail likes to buy ETFs. Today, we look at which ETF tickers retail seems to like the most. What the data shows is also a story of how to work trades in liquid stocks differently from trades in thinly-traded stocks.
Retail likes ETFs
The most recent data from our U.S. Retail Equity Flows (UREF) database shows that retail has been a consistent buyer of ETFs, adding over $270 billion to ETFs since January 2019, representing around 72% of all net retail buying.
Chart 1: Retail net buying is concentrated in ETFs
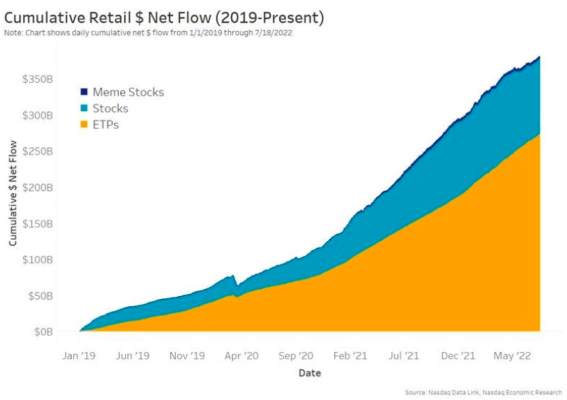
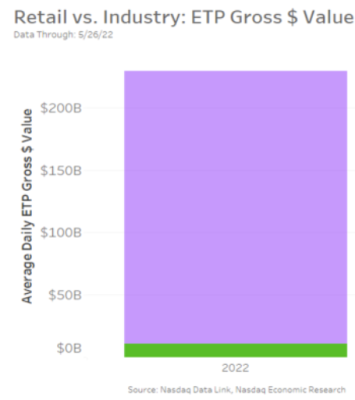
However, we also know that ETFs are very liquid, trading more than $200 billion per day. Consequently, even though retail likes to buy and hold ETFs, its trading adds to less than 5% of total ETF liquidity each day.
Chart 2: Retail trading makes up just a fraction of daily ETF liquidity
But that made us wonder, are there some ETFs that are more retail than others?
Which ETFs do retail investors like the most?
In the past, we’ve also talked about the two ways to guesstimate retail trading for each ticker using public data:
- We can look for sub-decimal prints, which is how most retail orders routed to wholesalers are filled.
- Or we can look at the non-ATS-TRF data from FINRA, which reports trading volumes by ticker and broker, allowing us to see what trades wholesalers and other liquidity providers have executed.
Doing that for ETFs produces interesting results. It also shows how imperfect each of the methods of guesstimating retail trading can be (Chart 3).
Chart 3: Liquid ETFs are more likely to use market orders sent directly to wholesalers, and thinly-traded ETFs are more likely to be facilitated
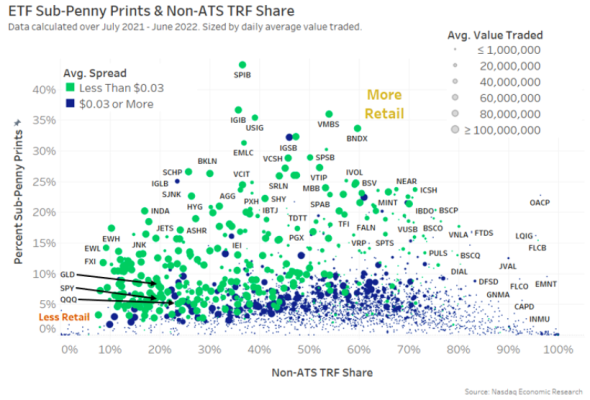
In theory, both ways of classifying retail should be close to equal, putting most dots on a diagonal. Then, the ETFs that retail likes the most, on a relative basis, would be in the top right of the chart. However, for many of the smaller blue dots, that’s not the case at all.
By coloring the data in Chart 3 to show liquid ETFs with tight spreads (green dots) differently than ETFs with wider spreads (blue circles), we see that liquid ETFs roughly follow the diagonal pattern we expected.
- Tickers like QQQ and SPY are closer to the origin of the chart – not because retail doesn’t trade them, but because professionals trade them so much more.
- The reverse happens for tickers like BNDX, VMBS, IGIB and VTIP—all of which are bond ETFs— where retail makes up a high proportion of all ETF trading.
We then size circles based on each ticker’s liquidity (value traded), where smaller circles are thinly-traded ETFs. This also shows a few trends:
- Almost all tight-spread ETFs (green) are also liquid ETFs (large circles), although other research suggests that liquidity helps narrow spreads (not the other way around).
- More liquid, wider-spread ETFs (larger blue circles) are more likely to be sent directly to wholesalers for price improvement.
- The least liquid ETFs (smallest circles) fall very close to the horizontal axis, indicating that even though they don’t trade much, they also rarely receive price improvement. Despite that, many also stretch well to the right of the chart, indicating that the majority of their trades are executed off-exchange.
This is, in fact, a good lesson in order handling.
Liquid ETFs have a lot of competing buyers and sellers, generating tighter spreads and deeper liquidity at the NBBO. That makes trading without causing market impact very easy, even for larger trades.
Thinly-traded ETFs also tend to have the widest spreads (see Chart 5 here), and usually have much less depth on the NBBO, too. That can make these ETFs expensive to trade using market orders that cross the spread. Instead, this data suggests that many of these ETFs are traded directly with liquidity providers, likely after competitive requests for quote (RFQ). When handled this way, trades are less likely to cause prices to gap up or down.
The reality
In reality, today’s analysis surprised us quite a bit. We thought that both our approaches to estimating retail interest in ETFs would yield similar results.
However, what the data shows is a good lesson in working orders differently for different types of securities. Something we also recently discussed in our Interns Guide to Trading.
It’s also why so much of our other research is focused on trying to improve tradability for all equities across the whole market cap spectrum—often by making things like spread and depth less different.