CalypsoArt/iStock via Getty Images
Introduction
After enduring a painful distribution reduction during late 2020 that halved their payments, thankfully the outlook was far more positive one year later for the unitholders of Energy Transfer (ET) with the prospects of seeing higher distributions returning soon, as my previous article discussed. Much to the pleasure of their unitholders, they marked the start of 2022 with a solid 15% increase that helps see their distribution yield at a high 6.97%. Even more excitingly, when looking ahead management has effectively flagged that a very high 12%+ distribution yield is now their top priority, as discussed within this follow-up analysis that also reviews their recently released fourth quarter of 2021 financial results.
Executive Summary & Ratings
Since many readers are likely short on time, the table below provides a very brief executive summary and ratings for the primary criteria that were assessed. This Google Document provides a list of all my equivalent ratings as well as more information regarding my rating system. The following section provides a detailed analysis for those readers who are wishing to dig deeper into their situation.
Author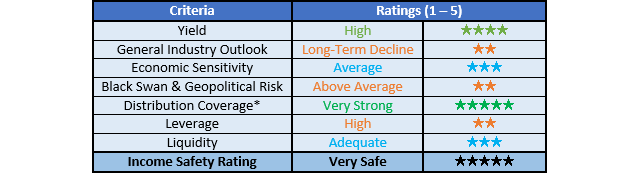
*Instead of simply assessing distribution coverage through distributable cash flow, I prefer to utilize free cash flow since it provides the toughest criteria and also best captures the true impact upon their financial position.
Detailed Analysis
Author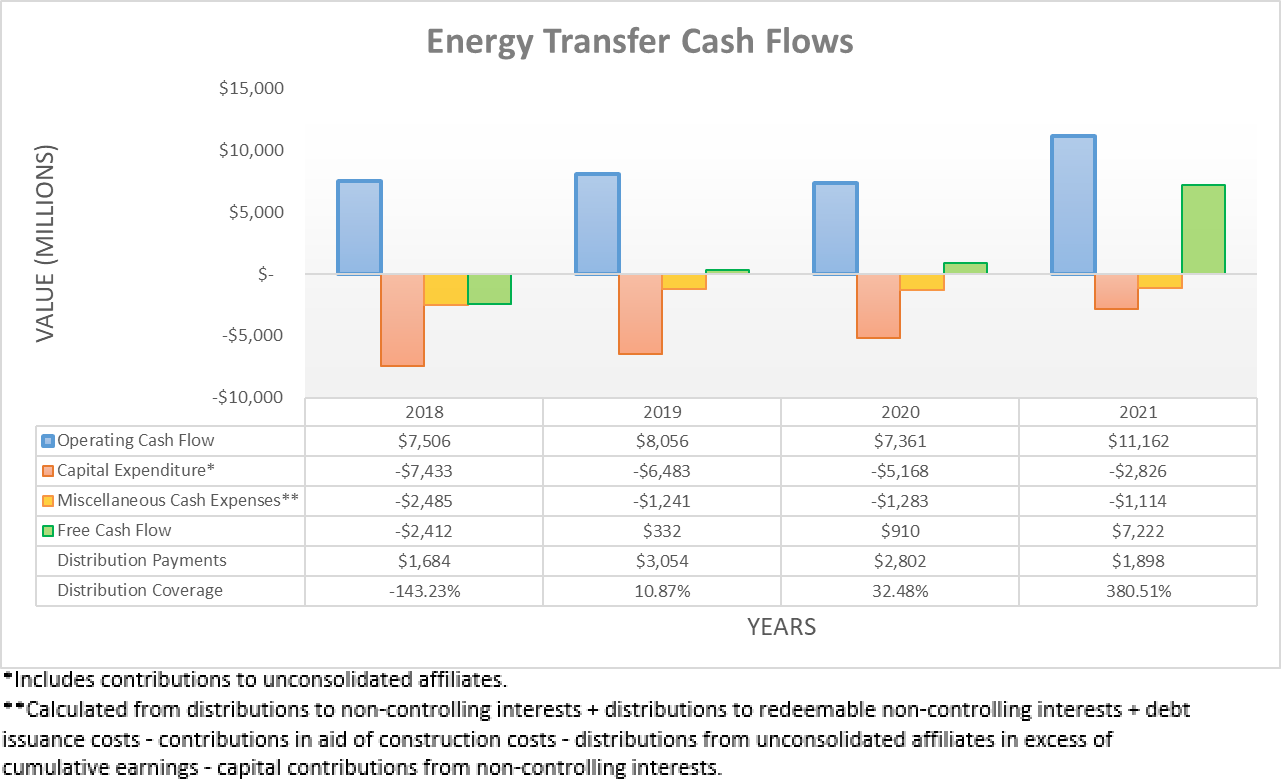
After seeing a very strong start to 2021 thanks to the Texas Winter Storm, the recovery across the energy sector during the remainder of the year saw their operating cash flow reach $11.162b, thereby setting a new record and sitting a very impressive 51.63% higher year-on-year versus their previous result of $7.361b during 2020. Whilst $515m of their operating cash flow during 2021 was due to a temporary working capital draw, even if removed along with the comparable $47m working capital draw during 2020, it still sees their underlying operating cash flow at $10.647b during 2021 and thus a very impressive 45.57% higher year-on-year versus their equivalent result of only $7.314b during 2020. When all was said and done, they ultimately produced a massive $7.222b of free cash flow that easily provided very strong distribution coverage of 380.51% to their distribution payments of $1.898b and thus provides scope for higher distributions, which very excitingly are now a top priority, as per the commentary from management included below.
“Future increases to the distribution level will be evaluated quarterly with the ultimate goal of returning distributions to the previous level of $0.305 per quarter or $1.22 on an annualized basis while balancing our leverage target, growth opportunities and unit buybacks.”
“So if you really look at this, returning to the — at least the $1.22 that we talked — that we had previously, back before we had reduced the distributions, that is moved up to a top priority, but we clearly have these great projects we’re talking about, likewise, these capital projects, then you blend in the debt paydown likewise. Unit buybacks, I would probably put as behind those 3.”
-Energy Transfer Q4 2021 Conference Call.
Thankfully management has not been vague with them clearly flagging that higher distributions are not only on the horizon with quarterly reviews but even more importantly, their top priority is at least reinstating their former annual distributions of $1.22 per unit that was paid before the COVID-19 pandemic and the resulting reduction during 2020. Apart from marking an end to a couple of painful years for their unitholders, this also stands to provide a very high 12%+ distribution yield on their current unit price of $10.05 and thankfully when looking ahead at their estimated free cash flow, this should not prove to be a difficult task.
When reviewing their guidance for 2022, they are forecasting an adjusted EBITDA of $12b at the midpoint, which is down a slight 7.70% from their result of $13b during 2021 that as a reminder, saw a significant one-off boost during the first quarter due to the Texas winter storm that briefly rocked local energy markets. If their underlying operating cash flow of $10.647b were to see a similar magnitude of change, which makes sense given their positive correlations, it leaves their estimated operating cash flow for 2022 at circa $9.8b.
On the cash outflow side of the equation, it firstly sees growth capital expenditure of $1.75b at the midpoint and given their maintenance capital expenditure of $581m during 2021, it seems reasonable to expect circa $600m during 2022, as per slides five and thirteen of their fourth quarter of 2021 results presentation. Once joined together, this sees capital expenditure for 2022 at circa $2.35b and after subtracted from their estimated operating cash flow of $9.8b it leaves $7.45b. Upon removing their usual circa $1.1b of miscellaneous cash expenses that mostly relate to their distributions to non-controlling interests as noted beneath the graph included above, it ultimately leaves their estimated free cash flow at a massive circa $6.35b.
Following their Enable Midstream acquisition during the fourth quarter of 2021, they have seen their unit count increase to 3,082,828,515 since it was a unit for unit swap, thereby meaning that would cost $3.761b per annum to reinstate their former annual distributions of $1.22 per unit. They also incur $280m per annum of preferred distributions, although thankfully these barely move the needle against their massive free cash flow.
Thanks to their estimated free cash flow during 2022 obviously eclipsing the cost to reinstate their former distributions and preferred distributions, they could also be left with circa $2.3b per annum of excess free cash flow after distribution payments, which not only makes it easy for management to achieve their top priority of reinstating their distributions but also leaves a margin of safety. If not utilized to fund unit buybacks nor acquisitions, this could be directed towards deleveraging or alternatively, it can also provide a buffer for increased growth capital expenditure in future years without jeopardizing their distribution coverage.
Author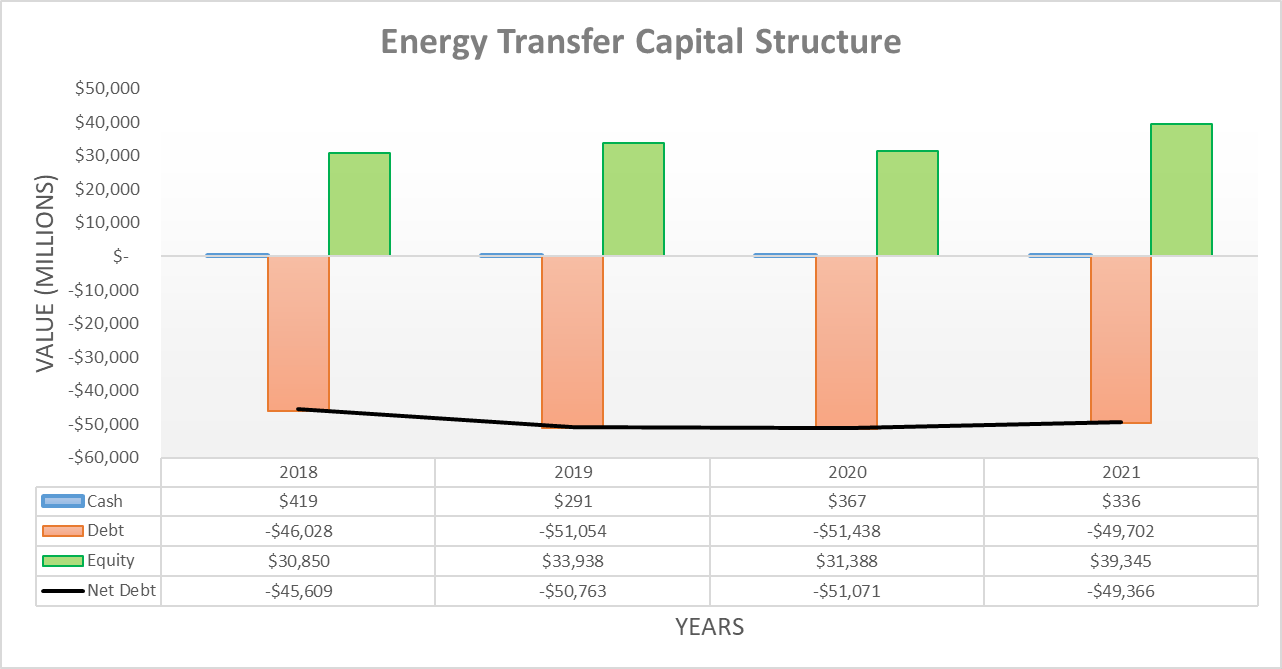
Since the previous analysis, their net debt increased to now sit at $49.366b, which stands above its previous level of $46.004b that followed the first half of 2021 but still remains below its all-time high point of $51.071b at the end of 2020. This stems from their Enable Midstream acquisition that saw its net debt of $3.968b consolidated into their balance sheet during the fourth quarter of 2021. When looking ahead into 2022, barring any further acquisitions or significant unit buybacks, their net debt should decrease by at least $3b given the previous cash flow estimation, if not even more because they it seems more likely that their distributions will be increased steadily each quarter instead of instantly being reinstated to their former level next quarter.
Author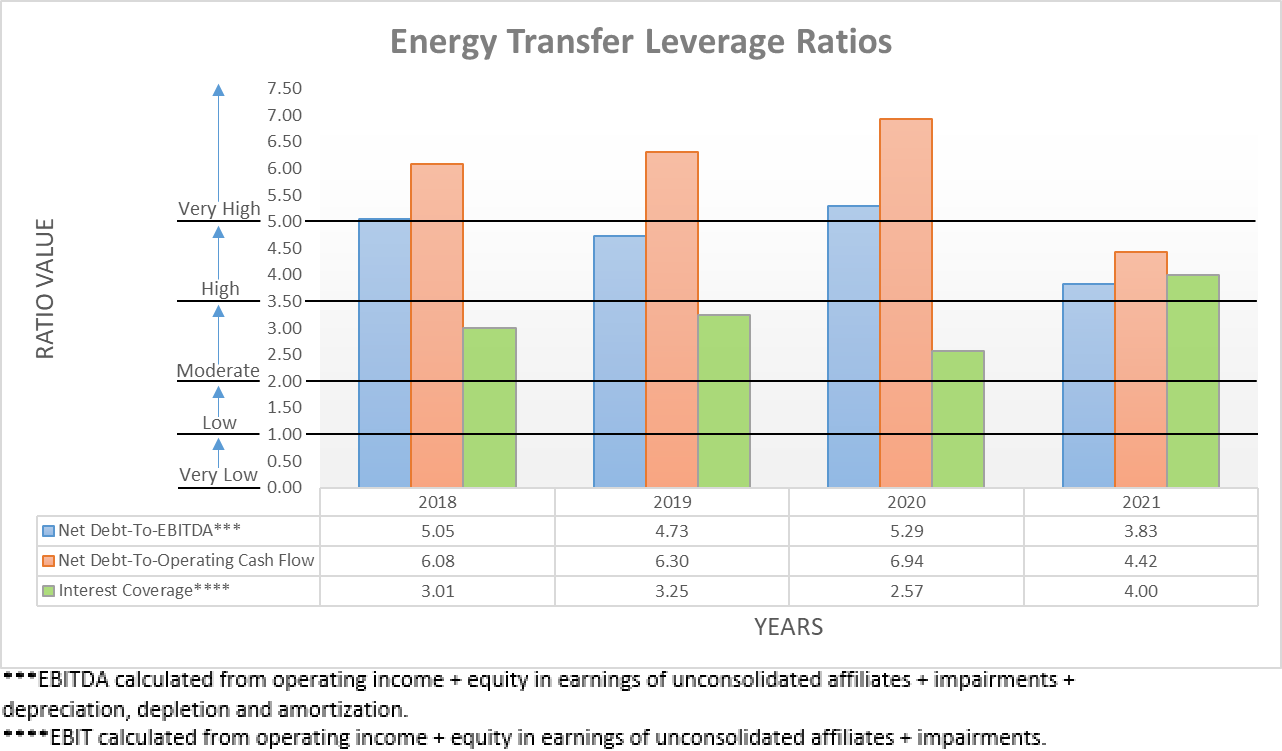
Following their very strong financial performance during 2021 and slightly lower net debt, it was not surprising to see their leverage decrease across the board with their net debt-to-EBITDA and net debt-to-operating cash flow falling to 3.83 and 4.42 respectively. Whilst these remain within the high territory of between 3.51 and 5.00, at least they are now well beneath the very high territory of above 5.01 where they both ended 2020 at 5.29 and 6.94 respectively.
If their net debt decreases by the $3b+ as previously expected, it would represent a mid-to-high single-digit decrease versus its current level of $49.366b and thus broadly mirror the previously mentioned circa 7% forecast decrease for their adjusted EBITDA, thereby seeing their leverage remain broadly unchanged following 2022. Whilst high leverage may not sound positive, given their prospects to still generate $2.3b per annum of excess free cash flow after distribution payments even after potentially reinstating their former distributions, it should continue trending lower and thus does not provide any material concerns, especially given the relatively steady nature of the midstream industry.
Author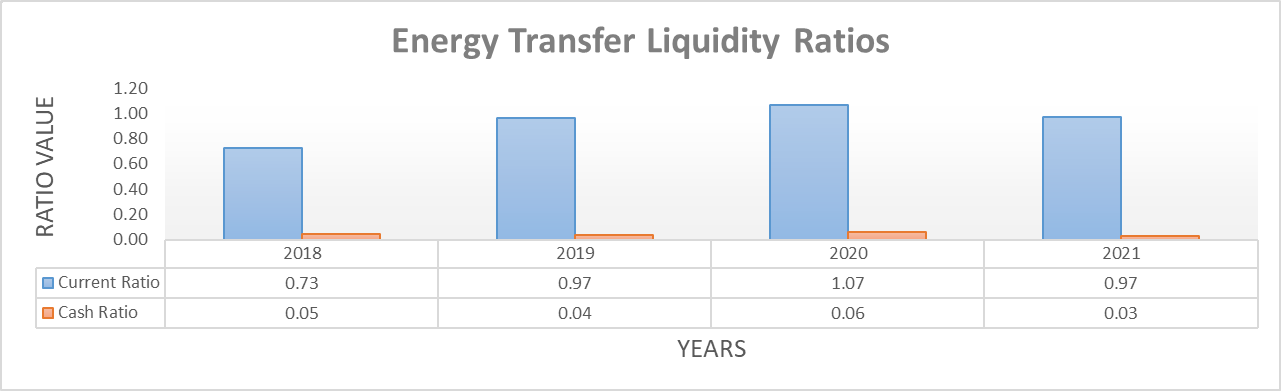
Whilst their liquidity is not a large concern given their ability to generate massive free cash flow, at least it nevertheless remains adequate with a current ratio of 0.97 that is effectively unchanged versus its result of 0.96 when conducting the previous analysis. Even though their cash balance is still very low relatively speaking with a cash ratio of only 0.03, it nevertheless is not too concerning thanks to their primary five-year credit facility that retains a further $2.03b available, not to mention the further multi-billion-dollar balances that are available within separate credit facilities for some of their various subsidiaries. Their very large operational size and healthy financial position should see this easy access to debt markets continue, thereby providing liquidity and the ability to refinance debt maturities as required, even if central banks tighten monetary policy.
Conclusion
Whilst higher distributions already seemed virtually assured back in late 2021, it has still been very exciting to not only see them increase 15% but to also see management flagging a reinstatement of their former distributions as a top priority. Thankfully they stand to generate ample free cash flow and thus management should have no issues making good on this goal whilst still being able to reduce their net debt. When completed this would see their current unit price trading with a very high 12%+ yield on current cost, thereby making it virtually certain to push their unit price higher with the market no longer able to overlook their immense value and thus it should be no surprise that I believe maintaining my strong buy rating is appropriate.
Notes: Unless specified otherwise, all figures in this article were taken from Energy Transfer’s SEC filings, all calculated figures were performed by the author