Lemon_tm/iStock via Getty Images
Written by Nick Ackerman, co-produced by Stanford Chemist. This article was originally published to members of the CEF/ETF Income Laboratory on April 7th, 2022.
Calamos Convertible Opportunities & Income Fund (NASDAQ:CHI) is off to a rough start for the year. However, it isn’t alone. It has been quite a struggle for most assets and sectors, excluding the energy sector, as the price of oil blasted off higher. CHI is mostly a convertible bond fund but still has some meaningful exposure to other corporate bonds.
Convertible bonds can offer a bit of a unique approach in the fixed-income space at this time. With higher interest rates, convertible bonds can provide a bit of a relief compared to other types of bonds. They generally correlate more closely with the issuing of the company’s common stock rather than other bond prices. This is due to their convertibility feature, where shares may be exchanged for common stock.
On the other hand, they have some downside protection that regular bonds have as well. At maturity, if it doesn’t make sense to convert, then an investor should receive face value back. There are a lot of low-yielding convertible bonds out there, some even at 0% yields. However, the other similarity they have with regular bonds is that investors can receive interest payments.
There are some downsides for convertible bonds to consider. On the subject of yields, due to the convertibility feature, they can pay less than traditional bonds. Therefore, if the conversion doesn’t make sense, you could be stuck with a lousy paying bond for years. An additional risk is that they are often issued by below-investment-grade. That leaves them more susceptible to defaults and the underlying company going bankrupt during economic slowdowns.
Another issue to consider with convertible bonds is that they are bought and sold between qualified institutional buyers or QIBs. They are often unrated because when larger institutions are buying them, they do their own risk assessments. That can leave less transparency for retail investors. Though this could be seen as a positive for CHI, it is a way for retail investors to gain exposure via a professional management company with the resources and knowledge that should.
The Basics
- 1-Year Z-score: 1.58
- Premium: 3.82%
- Distribution Yield: 9.01%
- Expense Ratio: 1.23%
- Leverage: 35.53%
- Managed Assets: $1.498 billion
- Structure: Perpetual
CHI states its objective as, “seeks total return through capital appreciation and current income by investing in a diversified portfolio of convertible securities and high yield corporate bonds.” This is fairly straightforward but can also be beneficial to retail investors.
Here is some additional commentary from Calamos on CHI:
…is an enhanced fixed income offering that seeks total return through a combination of capital appreciation and current income. It provides an alternative to funds investing exclusively in investment-grade fixed-income instruments and seeks to be less sensitive to interest rates. Like all Calamos closed-end funds, the Fund seeks to provide a steady stream of distributions paid out monthly and invests in multiple asset classes.
The fund’s expense ratio comes to 1.23%. When including leverage, this comes to 1.83% as of their latest Annual Report available. Their leverage is quite elevated, and that should be considered before investing. Additionally, as interest rates rise, some of their borrowing expenses are going to rise as well.
They have leverage in the form of a credit facility based on overnight LIBOR plus 0.80%. However, they also have several issues of preferred shares outstanding as well. These are fixed dividends unless the credit rating of the issues gets downgraded.
Holders of MRPS are entitled to receive monthly cumulative cash dividends payable on the first business day of each month. The MRPS currently are rated “AA-” by Kroll. If the ratings of the MRPS are downgraded, the Fund’s dividend expense may increase, as described below. If on the first day of a monthly dividend period the MRPS of any class are rated lower than “A” by Kroll, the dividend rate for such period shall be increased by 0.5%, 2.0% or 4.0% according to an agreed upon schedule. The MRPS’ dividend rate is also subject to increase during periods when the Fund has not made timely payments to MRPS holders and/or the MRPS do not have a current credit rating, subject to various terms and conditions. Dividends accrued and paid to the shareholders of MRPS are included in “Interest expense and amortization of offering costs on Mandatory Redeemable Preferred Shares” within the Statement of Operations.
CHI Preferred Outstanding (Calamos)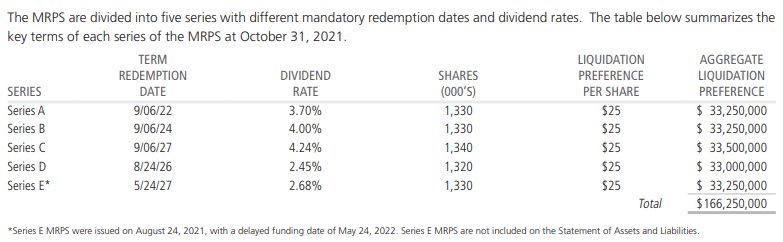
Later this year, the Series A will be redeemed. If it is replaced, it will likely be done so at a higher dividend rate, given the increased rates that are expected from the Fed.
Performance – 2022 Has Been A Struggle
CHI benefited in 2020 significantly due to massive interest in convertible bonds, especially those issued by high-flying tech companies. In 2021, the fund did alright, but it certainly was a setback when compared to the previous two years. For 2022, more specifically, so far, it has been tough. Below are the calendar year returns for CHI as of the end of March 2022.
CHI Annual Returns (Calamos)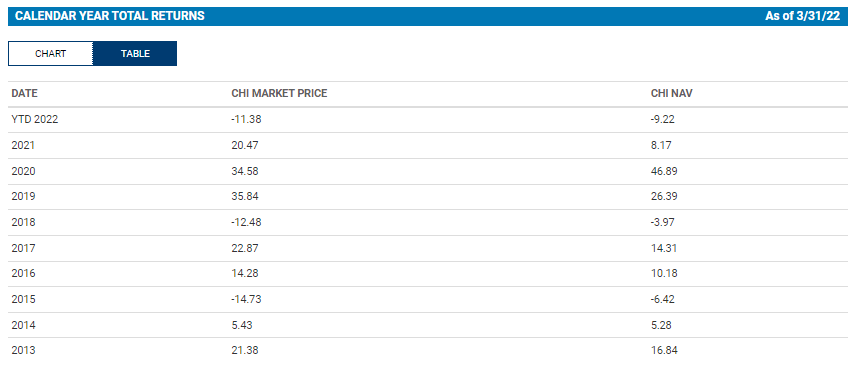
Below is the YTD performance. I’ve also included the iShares Convertible Bond ETF (ICVT). I have also included the SPDR S&P 500 ETF (SPY) and Vanguard Total Bond ETF (BND) for context. BND provides “broad exposure to the taxable investment-grade U.S. dollar-denominated bond market…” Of these, we can see ICVT coming in the weakest – but performing better than CHI. It would appear that convertibles as a whole have been getting hit a bit harder. The leverage that CHI employs has certainly been a detriment.
YCharts
On the other hand, the NAV has been holding up relatively better than the actual share price of the fund. That creates a situation in the CEF space where opportunities can start to open up. Over the last year, the fund has traditionally traded at a premium. More recently, the fund has been trading back and forth.
Over the long term for CHI, the fund has averaged a discount. The latest premium puts us over this average but this was only after the fund made some sharp moves higher back to a premium.

Distribution – Attractive 8.73%
One of the more attractive features of CHI is the monthly distributions. It works out to an 8.73% distribution yield at the current time. On a NAV basis, it works out to a rate of 9.06%, not too far off since the fund is only at a minor premium. This is undoubtedly elevated and has increased due to the declines the fund has been experiencing.
At this time, it doesn’t seem that a cut is entirely necessary, but it is more up to Calamos themselves on what they want to pay. They have cut their distributions in the past, most notably during the 2008/09 GFC. Then they held the payout steady for many years before they cut again in 2018. In 2021, they had once again boosted back to the prior 2018 cut level.
So, historically, they have adjusted as needed. However, they also let the yield itself run rather high before cutting. We aren’t above the average yield yet.

One of the reasons they can pay out basically what they want is because they rely significantly on capital gains to fund the distribution. They can still realize gains in the underlying portfolio, even if the NAV declines. However, it becomes more challenging to do that as time goes on if they erode assets away.
In fact, with their last report, they showed no net investment income at all. It just showed a loss on that line.
CHI Annual Report (Calamos)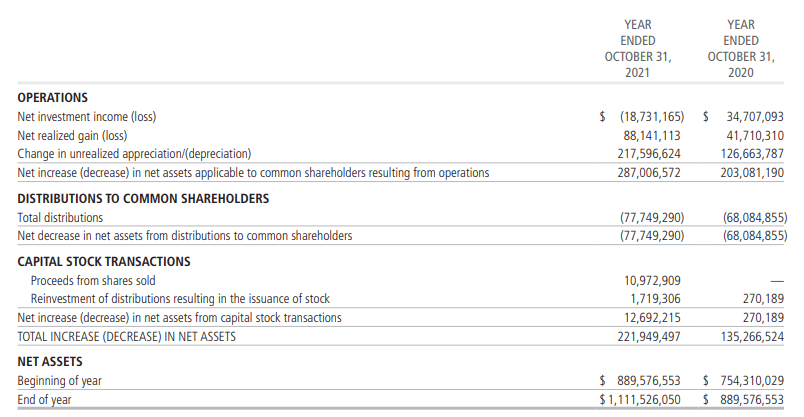
The reason for this was the same reason when we covered the Calamos Convertible & High Income Fund (CHY), CHI’s very similar sister fund. The total investment income or TII was down significantly due to amortization/accretion of investment securities.
CHI Annual Report (Calamos)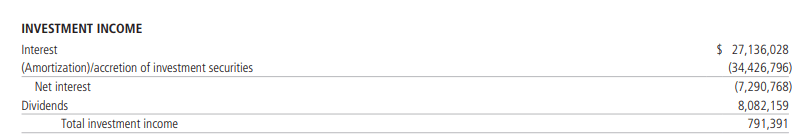
This isn’t a regular occurrence, and generally, NII contributes to some coverage for the distribution. Just not enough to cover the payout entirely; therefore, gains are still required.
The classification has been primarily ordinary income in the last two years for tax purposes. That means that CHI could be more appropriate for a tax-sheltered account.
CHI Annual Report (Calamos)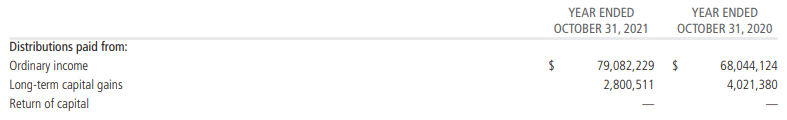
CHI’s Portfolio
The managers at CHI can be quite active. The fund reported a turnover rate of 46% for fiscal 2021. That was actually the lowest it had been in five years. The highest was in 2017, when it reported a turnover rate of 90%.
The bulk of the portfolio is invested in convertible securities. Corporate bonds make some meaningful exposure as well. These are through high-yield bonds. Those are also generally less interest rate sensitive since they have shorter maturities.
CHI Asset Allocation (Calamos)
The portfolio duration came to 2.6 years, which is rather low, thanks to how they are positioned. Though as a reminder, that positioning also makes them more susceptible to recessions and economic downturns.
CHI Duration (Calamos)
For their sector exposure, the largest exposure is tech. This has actually increased since the last time we took a look at the fund.
CHI Sector Weighting (Calamos)
One of the fund’s positions that makes a regular appearance is Tesla (TSLA). We once again see TSLA as the largest position for the fund.
CHI Top Ten (Calamos)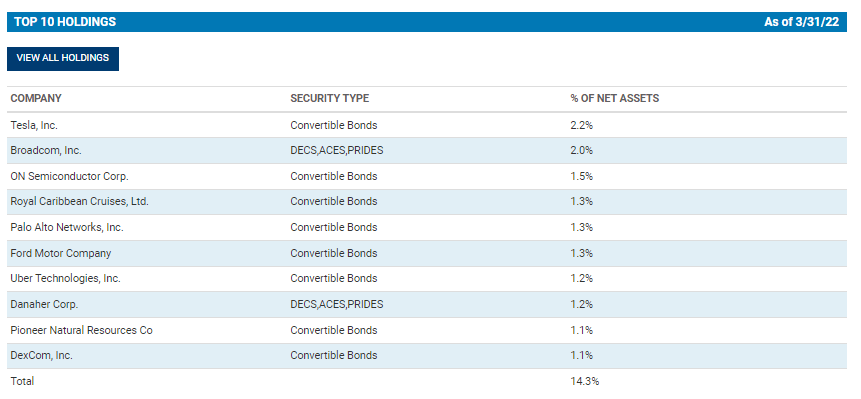
That being said, it is down from the 3.4% allocation they had previously. At the end of November 2020, TSLA was an even larger 5% weighting in the fund. It is great to see that the managers have been taking profits in the name. Some would argue that they haven’t taken enough profits yet, though, and wouldn’t like seeing TSLA at all in the fund. While I agree that the stock is quite expensive, it seems to be able to continue surprising investors and causing reason for the stock to trade higher.
Over the last year, TSLA shares are up over 50%. They had been trading down for quite a while. The latest push higher was after the announcement of a potential stock split via a stock dividend. However, as the market has cooled off more recently in the last few days, so have shares of this EV maker.
YCharts
Conclusion
CHI seems to still be a decent fund worth owning. I don’t see any red flags at this time that would make me want to sell out of my position immediately. With a small premium, the fund could still be considered for inclusion in a long-term investor’s portfolio. The convertible bond exposure of CHI makes it a bit of a unique fixed-income play. Rather than traditional bonds that are rate sensitive, the convertibles add some protection on that front if equities would start cooperating.