Theoretical background
Beam-hardening artefacts are caused by filtering the longer wavelengths out of the emitted x-ray spectrum so that the beam “behind” (in the path of the x-ray beam) the filtering object (e.g. a dental implant) significantly differs from the emitted beam in composition. Since it only contains the shorter (higher energetic) wavelengths, the beam is “hardened”. Unfortunately, the reconstruction process assumes equality between emitted and beam arriving at the detector. This discrepancy induces error in the reconstruction process visible as darker (combined with some brighter) lines and stripes that are always orientated in the direction of the x-ray-beam. The latter is the the opposite (inverse) direction of the reconstruction process which is based on (filtered) backprojection9. Titanium with an atomic number of 22 has been shown to considerably alter the x-ray spectrum for the typical energies (60–120 kVp) used in dentomaxillofacial CBCT-machines6. Zirconium as base-substance for zirconia-implants has an atomic number of 40, hence inevitably the beam-hardening effect will be more prominent when compared to titanium. Y-TZP-implants are composed of zirconium- and yttrium-oxide. Unfortunately no exact mass-attenuation coefficients are available from the National Institute of Standards and Technology Web site (physics.nist.gov). Hence, for an analytic evaluation on expectable artefacts caused by Y-TZP experimental attenuation measurements are required. We will derive the attenuation from zirconia and titanium from the 2D projection radiographs (PROJs) (Fig. 1) acquired in a CBCT machine during exposure. These digital radiographs are directly used for the 3D-reconstruction of the CBCT-volume. Unfortunately in digital radiography there is no direct relationship between gray-value and dose14. Thus a direct measurement of gray-values within the projection images used for 3D-reconstruction is not indicative for incident beam energy. This is due to in comparison to film an extremely wide dynamic range of digital receptors and due to the required processing of the images for display. In other words, the gray-value of a certain pixel finally displayed to the observer can only be examined in a relative fashion. Nevertheless, the basic idea behind this research is to still use gray-values measured within the projection images used for CBCT-reconstruction. By exposing low absorbing air in addition to Y-TZP or titanium, a “relative” attenuation coefficient can be computed which then can enter the evaluation regarding beam-hardening artefacts. As no information on the output intensity (I_{0}) of the source is easily available, the approach assumes that the intensity hitting the detector where only air is in the path of the beam most closely approximates (I_{0}). Absorbing air of roughly the same dimension is also in the beam-path for all other structures exposed, hence using gray-values within a zone of air versus those within the implant image seems to provide a reasonable approximation. This approach assumes linearity in the image processing by the manufacturer. Since the manufacturers use the intensity (gray) values measured in the detector from the multitude of PROJs directly for their reconstruction process, this is certainly a meaningful assumption.
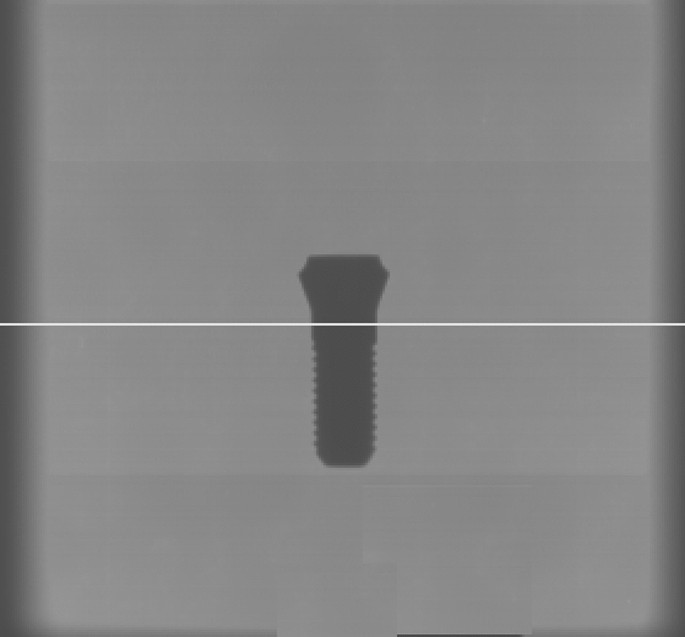
Exemplary 2D projection radiograph from the 3D Accuitomo with the Y-TZP-implant positioned in the center of the FOV. The white line represents the line along which the gray value profile was measured and evaluated, so that in eventually only the values within the implant image were used for computing transmission.
Theoretical model
To investigate the proportion of transmitted (not attenuated) radiation, neglecting attenuation by air we assume that emitted radiation equals the incident radiation in areas where only air is depicted. The linear attenuation coefficient is obtained from:
$$begin{aligned} I=I_{0}e^{-mu ,x} end{aligned}$$
(1)
which can be rewritten as
$$begin{aligned} mu =-ln frac{I}{I_{0}},x end{aligned}$$
(2)
with I and (I_{0}) representing incident and emitted intensity, respectively, and x the distance the x-rays traverse the absorber. (mu) in Eq. (2) denotes the “relative” mass attenuation coefficient under the assumption that the emitted intensity can be derived from the pixels in regions where only air was acting as absorber. The proportion of Intensity measured “behind” an absorber defines Transmission T, where (T=frac{I}{I_{0}}). After rearranging Eq. (2) and introducing the decimal logarithm we obtain the attenuation (A=log frac{I_{0}}{I}). As absorber a dental implant is assumed with radius r positioned at a focal-object-distance f (known from specifications of the CBCT-manufacturer) from the point-shaped x-ray source o that is at a distance h from the detector D (Fig. 2A).
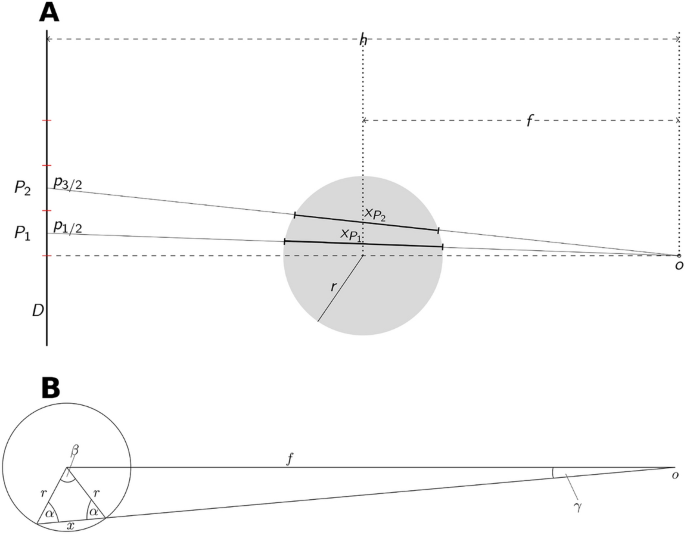
(A) Topview on the imaging geometry where the implant with radius r is exposed from the focal spot o on a detector D. The central x-ray is represented by the dashed line. Exemplarily the pixels (P_{1},P_{2}) with dimension p and the respective distances (x_{P_{1}},x_{P_{2}}) are indicated. Their centers are found at (p_{1/2},p_{3/2}). (B) Distances and angles within the implant-cross-section used for calculation of the the x-ray-paths through the implant.
The model bases on the computation of the distance x the beam passes through the implant (Fig. 2) in the part of the implant image, which represents the circular cross-section of the implant, i.e. that part which is traversed by the central x-ray. This distance x is given by
$$begin{aligned} x=2rcos left( arcsin left( frac{sin gamma f}{r}right) right) end{aligned}$$
(3)
for all angles (gamma in left( 0,gamma _{max}right)) (Fig. 2B) with:
$$begin{aligned} gamma _{max}=arctan frac{r}{d} end{aligned}$$
(4)
where d denotes the distance from o to the tangential point where the x-ray touches the implant. We aim to obtain x for the pixels (P_{i}) with (iin (1,ldots ,k)) denoting the k Pixels with side-length p that are covered by the implant shadow (Fig. 2) when counted from the central x-ray ((gamma =0)) into the periphery of the implants’ cross-section image. Consequently, the angle (gamma _{P_{i}}) between central x-ray and the ith pixel (P_{i}) is obtained from:
$$begin{aligned} gamma _{P_{i}}=arctan frac{ip-0.5p}{h}, end{aligned}$$
(5)
Image acquisition
CBCT scans were acquired from (a) an Y-TZP circonia implant (Patent, Zircon Medical Management AG Altendorf, Switzerland) of 4.1 mm diameter and a pure titanium rod (TICO, Titan Concept, Berlin, Germany) of diameter 4.0 mm. All exposure parameters (Table 1) were kept constant except for the four different beam energies (peak kilovoltages: 60, 70, 80, 90 [kVp], Table 1). CBCTs were acquired with the 3D Accuitomo 170- machine (J Morita Corp, Kyoto, Japan; internal filter: 3.1 mm aluminum) and standard exposure mode. For this purpose the implant was placed exactly vertically aligned fixed on a wooden rod in the center of the field of view (FOV), i.e. where the implant part used for the assessment was exactly centered within the field of view so that the central x-ray passes trough it. Under this assumption the line in Fig. 1 represents that plane where a circular cross-section of the implant is imaged. It should be noted, that only in this position the source-to-object-distance f as specified by the manufacturer (Table 1) is accurately applicable. This was ensured by means of the xyz-positioning-laser plus the scout function implemented in this CBCT-device. The latter enables accurate refinement of the initial laser-defined position by subsequently placing a mouse-driven aiming-rectangle on the monitor on the two perpendicular scout-radiographs. According to this refinement the machine corrects the position of the source-detector-unit relative to the object by means of motor-driven xyz-motion. The Y-TZP-implant coronally contains a cavern of approx. 3 mm depth for the abutment. Hence, the full-material part beneath that cavern yet above the thread had to be positioned in the center of the FOV to ensure that the full diameter of 4.1 mm Y-TZP was positioned in the location where the measurements subsequently were conducted in the projection images (Fig. 3). By accurately placing the measured part of the implants in the center of the FOV, the geometric assumptions described above (Fig. 2) are met as accurately as possible.
To assess repeatability, under identical conditions a second set of CBCTs was acquired several weeks after the first acquisition.
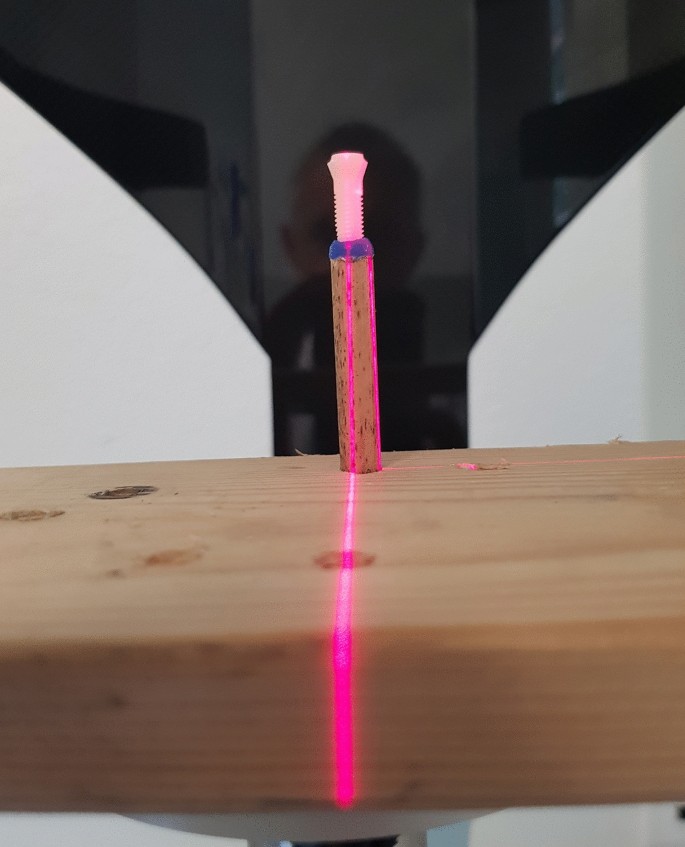
Set-up with the Y-TZP-implant centered and exposed in the CBCT-device. By means of the integrated laser-beam the central-ray was exactly centered in the field of view so that the required implant cross-section was centered in each PROJ.
Image evaluation and computation of attenuation
The 3D Accuitomo allows for export of the 578 PROJs as multi layer tiff-file. The single tiff-files (projection radiographs) were extracted using ImageJ (https://imagej.nih.gov/ij/download.html) and saved in original 16 bit depth (example see Fig. 1). Discarding the first 50 projection radiographs which in the Accuitomo contain no image data, the remaining 528 PROJs were divided by 10 so that every 52th PROJ was extracted to ensure equally distributed images over the 360(^circ) scan-arch of the device. In each of the resulting 11 projection radiographs per kilovoltage a horizontal line through the entire radiograph was constructed through the implant-body (Fig. 1) in the vertical center of the radiograph at the same y-coordinate. The resulting gray-scale profile of that line was saved as numerical values. Due to unavoidable small positioning errors of the implant in the device the implant-profiles slightly differed in their x-coordinate position in the PROJs. To reduce such errors the 11 profiles obtained over the 360(^circ)-range needed to be averaged. For this purpose, using R language and environment for statistical computing (R Foundation for Statistical Computing, Vienna, Austria) a numerical derivative of each profile was computed with its sharp maxima indicating the width of the implant-image in each line-profile. The profiles were symmetrically truncated on both sides of those maxima so that they exactly fitted to one another. In doing so, now only those values along the implant image were obtained which subsequently were averaged (11 profiles per voltage and material) to obtain a stable implant attenuation profile for further processing. In addition to the line-profile within the 11 PROJs per acquisition an area of 10 x 10 pixels in which only air was depicted was identified in the periphery roughly 1/4th from the image boundary. Since the Accuitomo integrates a non-removable carbonium-made headrest, for air-values no area was used containing the image of this headrest. These air-values were averaged over the 11 PROJs and defined as the maximum intensity (I_{0}) incident on the detector for the respective kilovoltage. PROJs from both acquisition instances were evaluated in identical fashion.
Computation of the distance x Due to the known imaging geometry and pixel size on the detector the cord-length x defining the distance an “x-ray” detected in the center of a pixel travels through the implant. For this purpose only the angle (gamma _{p_{i}}) for the ith pixel (p_{i}) can be computed and its’ value inserted into Eq. (4) to obtain the length of x. This is done for all pixels along the averaged line profile for each kilovoltage.
Computation of beam-hardening artefacts in the reconstructed CBCT-data The attenuation results were compared to the actual beam hardening occurring within the reconstructed implant phantom-images exported as DICOM-slices. Here, the reconstructed images of the first experiment were evaluated. To quantitatively compare beam hardening effects between the two materials and the energies, for all four energies line plots centered in the center of the cross-sections (Fig. 5) were generated extending over the edges of the implant image. This was done over a range of 170(^circ) so that 17plots were available per energy. These were averaged (per energy) and the numerical derivative for each mean profile computed. By using the maximum values of the first derivative the profiles were subsequently centered to one another and averaged. In doing so, one gray-value profile was computed for each beam energy (Fig. 6). In addition maximum relative differences between the central gray value within the implant images between 90 and 60 kVp were computed for both materials.
Method error Method error is described as difference in the computed transmission between the two acquisitions. These were evaluated by means of the paired T-test and a level of significance of 5%.