jodie777/iStock via Getty Images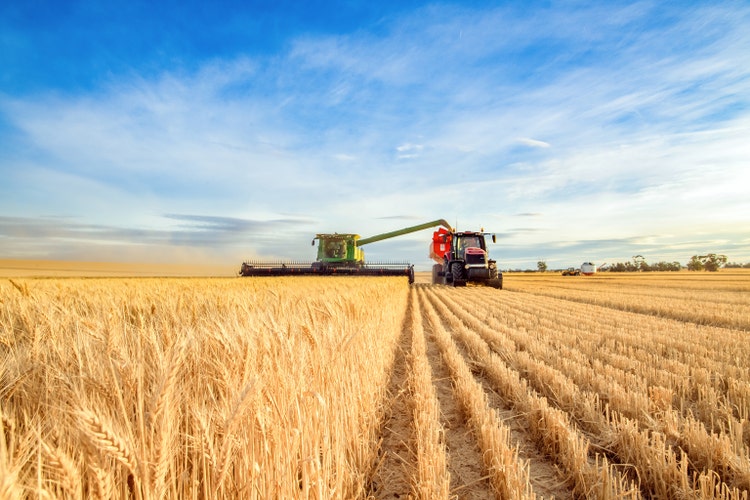
Potential Agricultural Supply Shortfalls on World Markets
As Russia’s military is at the cusp of conducting a hostile takeover of Ukraine, energy and gold prices are soaring as I forecast in my SA article published 16 January 2022 Energy and Gold Prices to Soar After Likely Russian Invasion; global food prices may rise as dramatically as their energy & gold counterparts.
Russian military land forces are at various points of the Ukrainian border and the Russian navy controls the Black Sea, effectively blockading five critical Ukrainian ports utilized for grain exports: Odessa, Mykolaiv, Kherson, Mariupol and Berdyansk. It remains to be seen whether Ukrainian agribusiness will be able to plant, harvest and sell their agricultural products for export. With respect to timing, the planting takes place in the spring and harvesting in late summer and early fall.
Due to the aforementioned uncertainties, there may be a considerable shortfall of crop yields and/or limits or restrictions of Ukrainian agricultural exports, Europe’s breadbasket and export powerhouse, whether as a result of a temporary blockade or long-term limit or restriction.
For these reasons, I believe that agricultural goods prices have a strong upside potential to stay elevated for the near to medium term over and above the present-day inflationary trends. Furthermore, I believe that the markets have not priced in this additional risk which presents excellent buying opportunities.
Investing in Agricultural Funds
The following listing of agricultural funds include options for a broad-based investment or more specific.
As a refresher, with respect to their basic differences, an ETF one invests in a fund of the asset that it tracks while an ETN is like a bond, an unsecured debt note issued by an institution.
Agriculture | broad based
- Teucrium Agricultural Fund (TAGS)
- iPath Series B Bloomberg Agriculture Subindex Total Return ETN (JJA)
- ELEMENTS Linked to the Rogers International Commodity Index – Agriculture Total Return ETN (RJA)
Wheat
- Teucrium Wheat Fund (WEAT)
Corn
- Teucrium Corn Fund (CORN)
Grains
- iPath Series B Bloomberg Grains Subindex Total Return ETN (JJG)
- ELEMENTS Linked to the ICE BofAML Commodity Index eXtra Grains Total Return (GRU)
The Downside Risk
My forecast of a sharp price increase for agricultural products because of potential or actual hostilities in Ukraine could be muted by the exports of agricultural powerhouses such as the US, Canada, Brazil and other European countries to countries that heavily depend on Ukrainian agricultural exports.
However, I believe that there would be a gap between actual restrictions on Ukrainian exports and the subsequent replacement exports from the aforementioned countries. Furthermore, there will still be a shortfall to meet normal demand of some kind because of the lack of available ships to transport the goods.
Ukrainian Agricultural Overview
The importance of Ukrainian grain production and exports cannot be overstated. The 2022 agricultural yield forecasts a considerable increase from previous years. Ukraine’s average annual yield is three times its domestic needs, making them one of the world’s largest agricultural exporters.
The following data are particulars for each crop provided by the World Data Center for Geoinformatics and Sustainable Development:
- Ukraine’s grain output consists of wheat, corn, barley and rye.
- 4th largest exporter of corn (eastern and southern Ukraine), planted in April/May, harvested in September; and barley (eastern Ukraine), planted in April and harvested in August.
- 6th largest exporter of wheat (south and south-central Ukraine). It’s a winter wheat planted in fall and harvested the following summer.
- 7th largest exporter of soybeans.
- World’s leading sunflower seed oil exporter (southern and eastern regions), planted in April harvested in September. It’s their most profitable crop because of low production costs and high demand.
- Most exports are shipped to Spain and Italy, North Africa, the Middle East and East Asia (China, Japan, Korea).
- Russian and Ukrainian grain production represents 30% of the world inventory, a market share that doubled since 2014.
Global Food Supply & Prices
World food prices began ascending dramatically in 2021 and will accelerate in 2022. The pre-war market factors are as follows:
- Higher prices for pesticides.
- Higher prices for fertilizers.
- Severe meteorological events such as floods & droughts have adversely impacted crop yields.
- Labor shortage in logistical and agricultural services.
- Global supply chain disruptions.
Finally, the food export restriction policy of even small countries impacts global food prices as illustrated on the following link called the exponential domino effect in which a seemingly small and insignificant factor becomes a powerful multiplier effect that triggers an outsized crisis far beyond its domestic borders.
One such example is that in 2021 Russia placed export taxes on their grain crop to keep more inventory homebound. For this reason, countries that purchased Russian grains were forced to search for alternative sources such as nearby Ukraine.
The following chart entitled Food and Agricultural Organization of the United Nations (FAO) food price index indicates an explosive price increase in major food categories. These food prices will skyrocket when war rages in Ukraine.
FAO Food Price Index (FAO of the United Nations)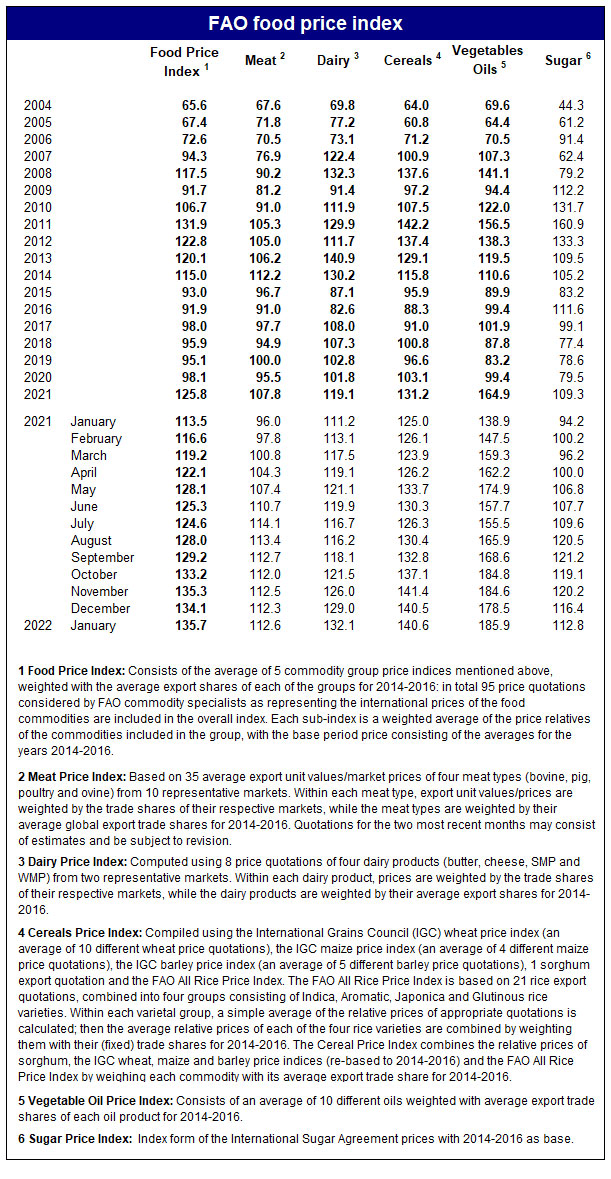
Russia & Ukraine Do Swimmingly Well in a Water Stressed World
Russian and Ukrainian agricultural production have enjoyed a stunning success of bountiful crops and whose harvest regions have avoided, by default or design, becoming water-stressed. As most other countries struggle with grain production in the future, Russian and Ukrainian grain production will be robust giving them increased market share and greater pricing leverage.
The following chart is entitled Where Water Stress Will Be Highest by 2040 provided by the World Sources Institute via the Economist Intelligence Unit forecasts this trend globally for the next 18 years. The UN defines “water stress” as when a country withdraws least 25% of its renewable freshwater supply.
Where Water Stress Will Be Highest by 2040 (World Resources Institute via The Economist Intelligence Unit)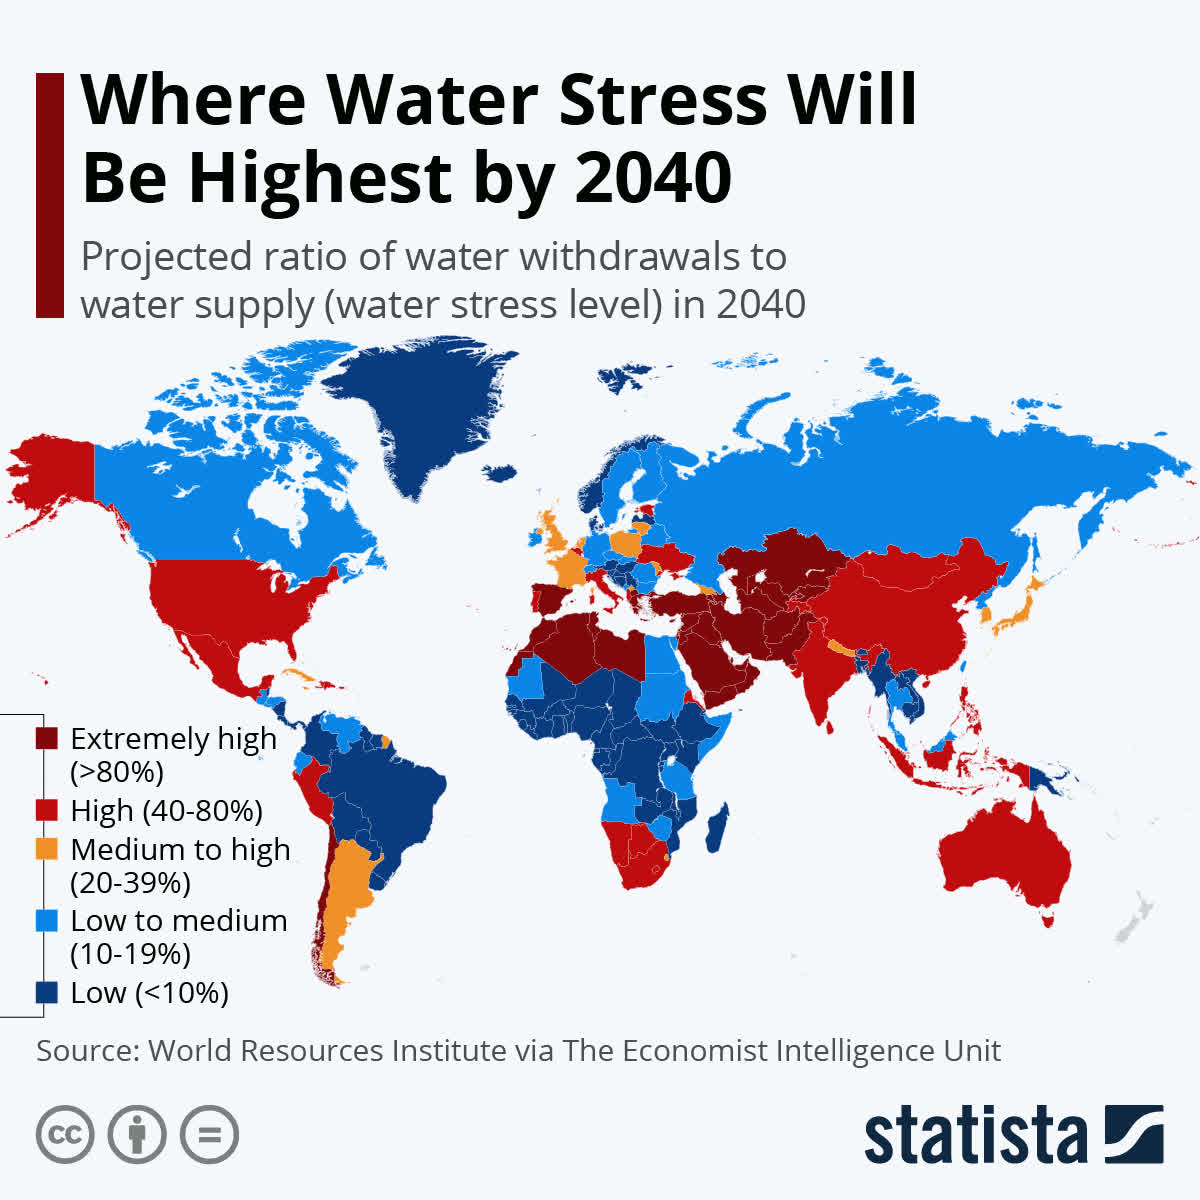
Conclusion
A Russian invasion and occupation will further squeeze an already tightening food market since many governments have, officially and unofficially, limited or even banned outright export of domestic agricultural products. This has been done for the purposes of food security and maintaining affordable food prices to avoid socio-political instability.
For all the aforementioned reasons, I forecast dramatically rising agricultural prices and recommend investing in the agricultural sector.