
Introduction
As of July 5, 2020, the number of confirmed cases of COVID-19 worldwide stood at more than 11·2 million, with more than 529 000 deaths.
213 countries and territories have reported confirmed cases of coronavirus. In India, the first case was reported on Jan 30, 2020, among a group of students who arrived in the southern state of Kerala from Wuhan, the epicentre of the outbreak at that time. As of July 5, 2020, in India, more than 648 300 confirmed cases have been reported, of which around 235 433 (36%) were active, 394 227 (61%) recovered, and 18 655 (3%) died.
These cases were spread over 35 (97%) of 36 states and union territories and 627 (98%) of 640 districts of the country.
expressed concern about the spread of COVID-19 and its potential to cause more than 1·7 billion infections and 7·6 million deaths in south Asia alone if action is not taken. India is the world’s second most populous country and the largest in south Asia, with a population of nearly 1·4 billion, therefore, it is at risk of having the largest share of these potential infections and deaths. Realising the gravity of the threat, the Indian Government put in place several measures, including stopping all international passenger flights (effective March 22, 2020), implementing a 40-day strict nationwide lockdown (from March 25, 2020), which was extended by 8 more weeks with some relaxation,
steps towards boosting health infrastructure, and a large mass media campaign on the importance of social distancing and personal hygiene measures.
a large number of people with chronic morbidities,
a substantial proportion of the population living below the poverty line,
and a large number of migrant workers who move from one state to another for their livelihoods.
According to data from the Indian Government, more than 80% of confirmed cases in India are asymptomatic,
making the population vulnerable to community spread of the virus. Although the epidemic appears to be concentrated in more affluent and industrialised districts,
with millions of migrant workers from these areas moving to their home districts after the lockdown eased,
it is only a matter of time before the virus spreads to the rural hinterlands of India. The question arises over whether these districts are ready for the virus and its consequences.
Evidence before this study
Application of social vulnerability indices in disaster management and identification of vulnerable people and regions are not novel. There have been several studies globally and a small number in India that proposed social vulnerability indices while tackling a climatic disaster. In the era of COVID-19, we found one study in the USA that developed a vulnerability index with specific application to COVID-19. In this study, a COVID-19 community vulnerability index was computed by improvisation on the existing social vulnerability index used by the US Centers for Disease Control and Prevention by adding indicators relevant to the novel coronavirus pandemic. The index was calculated using US census track-level data for identification of vulnerable regions and to help prepare local-level responses and risk mitigation strategies. Although not a full-scale study, an editorial in The Lancet posed questions on so called one-size-fit-all strategies and recommended local-level planning based on specific vulnerabilities of population groups or regions. To understand and forecast the economic repercussions of the severe acute respiratory syndrome coronavirus 2 (SARS-CoV-2) outbreak, work has been done to measure an index of economic resilience of communities. We searched web-based coverage of the SARS-CoV-2 outbreak and PubMed and Google Scholar for peer reviewed publications on the outbreak and vulnerability indices published between Jan 1 and April 30, 2020. We used the search terms “Corona virus outbreak”, “Covid-19 vulnerability index”, “social vulnerability”, “economic vulnerability”, and “social distancing” separately and in combinations. We did not find any relevant literature on construction of a district-level vulnerability index in an Indian context that captured how vulnerable different regions are in their ability to mitigate and respond to the COVID-19 epidemic.
Added value of this study
To our knowledge, our study is the first to develop a composite measure of community-level vulnerability concerning the COVID-19 situation in India. We defined vulnerability through five domains that are important when preparing for, mitigating, and reducing the consequences of the coronavirus epidemic. Our operationalisation of the vulnerability index considered the risk of consequences of coronavirus infection to a population, rather than the risk of infection (or susceptibility) itself. The main value of our study is the state and district ranking provided to policy makers to prioritise resource allocation and devise effective mitigation and reconstruction strategies for affected populations. Although we applied our methods to states and districts of India, we believe that they can be used in other countries that are at different stages of the epidemic and have the required indicators available.
Implications of all the available evidence
To contain the outbreak of COVID-19, the Indian Government imposed a countrywide lockdown for 40 days initially, and extended this by 8 weeks with gradual relaxation. The government has started phased lifting of the lockdown restrictions by assessing the current situation based on the incidence of positive cases, the doubling rate, and several other factors. Our findings could help the government identify the regions that might have potential severe consequences of the COVID-19 outbreak, which is particularly important because of the risk of reintroduction of the virus posed by millions of returnee migrant workers. Both the domain-specific and overall vulnerability index will help prioritise resource allocation in the face of constrained resources during the epidemic.
equating the COVID-19 epidemic to a national disaster, laying down the policies, plans, and guidelines for management of the epidemic and ensuring a timely and effective response to the disaster, for example, nature of lockdown measures, disease containment plans, guidelines on social distancing, testing strategies, and contact tracing and isolation strategies. Centrally coordinated local-level planning is essential for mitigating both the short-term and long-term devastating effects of the epidemic on economic, health, and social wellbeing in the affected areas and their populations.
Mathematically, risk is often expressed as hazard × (vulnerability – resources).
Although disaster management deals mostly with physical hazards, the vulnerability of a population is frequently considered in the literature to mean their geographical location or other physical vulnerabilities, rather than their social vulnerability. The manner in which hazards might affect the population must be of foremost importance, but understanding how and where vulnerable communities might be impacted can greatly help with effective allocation of resources during the different disaster management phases—prevention, preparedness, response, mitigation, recovery, and reconstruction.
vulnerability in the present context is a dynamic concept—a person or a group might not be vulnerable at the beginning of the pandemic, but could subsequently become vulnerable depending on the government response. Beyond the groups who are epidemiologically vulnerable to COVID-19 (eg, older people and individuals with comorbidities), there might be people from diverse socioeconomic backgrounds who are vulnerable as they struggle to cope with the crisis in various ways—financially, mentally, or even physically.
Thus, to appropriately respond to and manage the COVID-19 pandemic, knowledge and understanding of social and other community vulnerabilities is critical. The most vulnerable communities could be those who are at the receiving end of short-term and long-term effects of the pandemic, but whose needs might not have been sufficiently considered in the planning of local responses and relief.
A recent review by Fatemi and colleagues
provided an extensive account of such studies. In India, little literature is available on use of social vulnerability indices, and mostly in relation to disastrous climatic events.
,
Our study attempts to fill the gap in the literature on social vulnerability indices in India.
In this context, we attempted to provide a tool for district-level planning and responses to the COVID-19 epidemic in India. We computed a set of indices to rank each district of India under five domains—socioeconomic, demographic, hygiene, health system, and epidemiological—which make them vulnerable to a natural disaster in general, as well as the COVID-19 epidemic.
Methods
Study design
Census of India 2011,
Rural Health Statistics 2018,
and National Health Profile 2019.
used by the CDC to compute social vulnerability indices for each census track in the USA. Flanagan’s social vulnerability index includes four domains—socioeconomic status (comprising income, poverty, employment, and education variables), household composition and disability (comprising age, single parenting, and disability variables), minority status and language (comprising race, ethnicity, and English language proficiency variables), and housing and transportation (comprising housing structure, crowding, and vehicle access variables). We expanded the concept and computed vulnerability under different thematic domains, extending beyond social vulnerability to accommodate vulnerability related to the COVID-19 pandemic.
Table 1Domains of vulnerability and variables within
Socioeconomic vulnerability
hence it is important to consider the socioeconomic condition of a population when creating a vulnerability index. We used the following three indicators to define socioeconomic vulnerability: the proportion of the population belonging to scheduled castes and tribes (to represent socially marginalised groups in India), the proportion of the population with secondary or higher education (to represent education level in the population), and the proportion of the population who did not have any of certain assets (motorised vehicle, television, computer, bicycle, refrigerator, thresher, and air conditioner or cooler) as a proxy for poverty.
Demographic vulnerability
The nature of the COVID-19 epidemic is such that both the pace of transmission and mortality due to infection depend on the demographic composition of the population, hence demography should be part of a vulnerability index. We considered the following three indicators to represent the demographic composition of a population in the context of COVID-19: the proportion of the population aged 60 years and older, the proportion of the population living in urban areas, and population density.
Housing and hygiene conditions
Housing conditions, particularly intrahousehold crowding, sanitation, and hand hygiene, are important factors in COVID-19 transmission and thus constitute an important domain of vulnerability. We considered the following three indicators for this purpose: the mean number of people sharing a room in a household for sleeping, the proportion of households having their own toilet, and the proportion of households having soap and water available for handwashing.
Availability of health care
The management of an epidemic and the treatment seeking ability of a population depend on easy and affordable access to well capacitated health-care systems and health security, and thus should be included in the vulnerability index. We chose the following three variables to represent health security, accessibility of affordable health care and health-care system capacity: the proportion of households with health insurance, the proportion of households who reported no nearby public health facility, and the number of public hospitals per 100 000 population (for district level) and number of hospital beds per 1000 population (for state or union territory level).
Epidemiological factors
There are several known epidemiological factors that might put a population at risk of higher morbidity and mortality by COVID-19 infection and thus merit inclusion in the vulnerability index. Because of the paucity of data on the prevalence of comorbidities in older people (aged 60 years and over) we captured epidemiological factors through the following three variables: the proportion of men (aged 40–54 years) and women (aged 40–49 years) who reported having any of cardiovascular disease, diabetes, asthma, or cancer, and the proportion of men who smoked tobacco.
Construction of the vulnerability index
15 indicators were used to define vulnerability across five domains at both the district and state level. First, each of these indicators were computed from the respective data sources to arrive at district-level indicators. The mean of all the districts in a state was then computed to arrive at state-level indicators.
Within the district (or state) datafile, each indicator was arranged in increasing or decreasing order of prevalence in such a way that the higher the value of the indicator the higher the vulnerability. Ranks were then assigned to districts (or states). In case of ties, the lowest rank value in the string of ties was assigned to each tied case. After assigning a rank to the district (or state) the percentile rank was calculated. The percentile rank was the percentage of districts (or states) at or below that rank score. The following formula was used to calculate the percentile rank of each indicator for each district or state: P=(rank – 1)/(N – 1), where P is the percentile rank and N is the total number of districts or states.
for calculating the social vulnerability index.
In 2014, the state of Andhra Pradesh was divided into two states—Andhra Pradesh and Telangana—meaning there were now 30 states and six union territories. Although there are currently 736 districts in India because large districts have been split into new districts for ease of administration, since the data required for this paper were not available for the newly defined districts, we considered only the 640 districts that had administrative boundaries defined in the 2011 census. To measure reliability of the index, we computed Chronbach’s α for the overall vulnerability index. We also computed Pearson’s correlation between domain vulnerability indices and overall vulnerability index. All analyses were done using Stata version 16.0.
We generated choropleth maps at district and state levels to show the spatial distribution of domain-specific and overall vulnerability. The number of COVID-19 cases (as of June 17, 2020) in each district was plotted over these maps to show the spatial distribution of confirmed coronavirus cases in contrast to their relative vulnerability. 2011 census shape files at district and state levels were used and the Stata spmap command was implemented to construct the maps.
Role of the funding source
There was no funding source for this study. The corresponding author had full access to all the data in the study and had final responsibility for the decision to submit for publication.
Results
Table 2Domain-wise and overall COVID-19 vulnerability index by state (in order of increasing overall vulnerability)
Table 3Domain-wise and overall COVID-19 vulnerability index by district (20 least vulnerable districts)
Table 4Domain-wise and overall COVID-19 vulnerability index by district (20 most vulnerable districts)
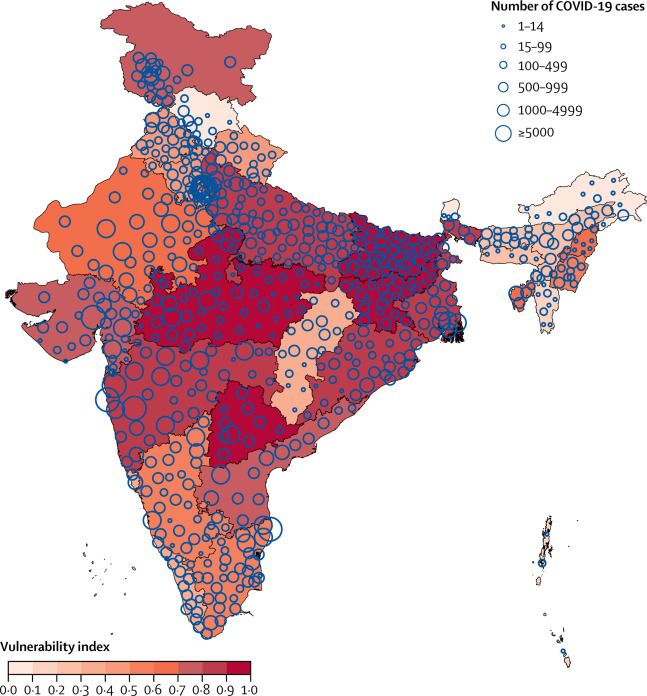
Figure 1Overall COVID-19 vulnerability index in states and union territories of India and number of confirmed cases as of June 17, 2020
This map does not reflect changes made in Jammu and Kashmir state (now union territory) in August, 2019.
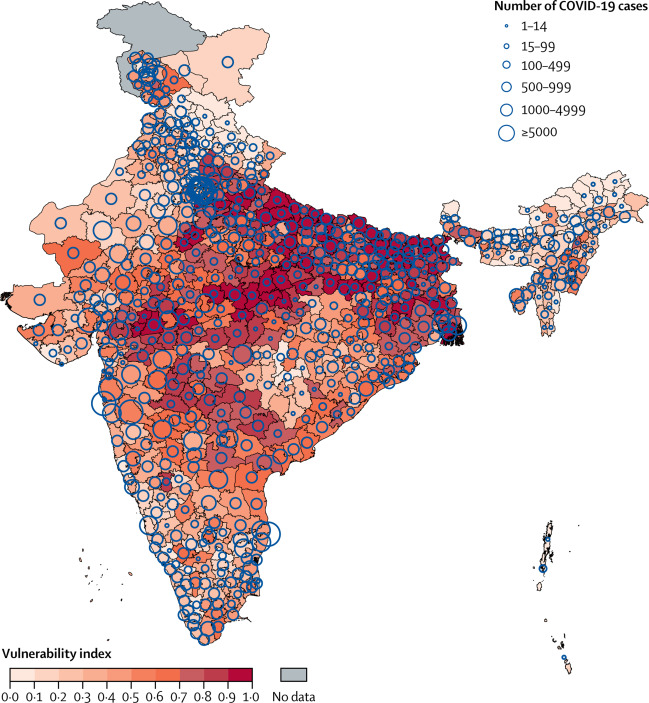
Figure 2Overall COVID-19 vulnerability index in districts of India and number of confirmed cases as of June 17, 2020
This map does not reflect changes made in Jammu and Kashmir state (now union territory) in August, 2019.
Discussion
its far-reaching consequences need effective planning
and require the right kind of data. In this study, we report a state-level and district-level vulnerability index that is designed to aid government efforts to effectively respond to the fast-developing COVID-19 epidemic in India. These data are meant to be used by planners to target vulnerable populations and support them to prepare for, and to mitigate and reduce, health and socioeconomic consequences of COVID-19.
The results of our study show that districts in nine of 30 large states—Bihar, Madhya Pradesh, Telangana, Jharkhand, Uttar Pradesh, Maharashtra, West Bengal, Odisha, and Gujarat—have high overall vulnerability. These states also have high vulnerability according to many of the five domains that we considered. Districts in nine states and five union territories have relatively low vulnerability, and states in the northeast dominate those with low vulnerability.
With no vaccine or effective treatment available, some form of the epidemic will continue to affect life across the world, including having a severe impact on the economy. In India, after a steady beginning the epidemic has more recently shown exponential growth. Thus, the country is dealing with a large increase in new cases over a short period of time. During the 6 week period beginning on May 2, 2020, the number of districts with confirmed cases increased from 359 (or 56% of all districts) to 627 (98% of all districts).
Most of these people travelled to Uttar Pradesh and Bihar, followed by Madhya Pradesh, Punjab, Rajasthan, Uttarakhand, Jammu and Kashmir, and West Bengal and, indeed, we observed that these are some of most vulnerable states according to the vulnerability indices. Another important issue is that most of these migrant workers are returning from states with a high burden (in terms of active cases; eg, Delhi, Maharashtra, Tamil Nadu, Gujarat, Andhra Pradesh, and Kerala) to lower-burden but highly vulnerable districts in their own states, possibly carrying back infections. Our vulnerability index and data on migration might help local authorities prepare for and better mitigate the increasing threat of virus spreading in their districts.
The domain-specific and overall vulnerability index presented here can also be combined with other available information, such as disease transmission, case fatality rate, the proportion of cases needing hospitalisation, intensive care unit admissions, or ventilator support to heighten the preparedness of a district or state, as well as planning and executing the response.
Several aspects of the vulnerability index should be discussed. First, there is an apparent conflation between the concepts of susceptibility and vulnerability. In the context of COVID-19, susceptibility means the risks of getting infected by the virus, which are determined by several epidemiological factors, individual hygiene practices, and the ability to maintain physical distance from others. By contrast, vulnerability means the risk of consequences of infection, including spread, morbidity and mortality, and social and economic consequences. Our vulnerability index includes demographic indicators that might represent both susceptibility and vulnerability. For example, although a dense urban area is susceptible to COVID-19 infection, older people who live in that population are vulnerable to severe mortality and morbidity. Second, being based on ranking of districts (or states) for 15 indicators, our vulnerability index provides a relative position of a district (or a state) compared with other districts (or states) in the country, rather than being an absolute score. We believe that an absolute vulnerability score is less useful to planners and managers of an epidemic than a relative index, as they need to allocate available resources on a priority basis. Third, the vulnerability index proposed in this study is simple and additive and has a reliability of 0·6 (Chronbach’s α). However, we were unable to test the external validity of our vulnerability index as there is no known measure of comparison. Fourth, our index uses equal weights to combine individual indicators and domains, but researchers have argued that all the domains are not equally important and hence should not be given equal weight. However, alternatives such as using factor weights (based on an exploratory factor analysis of components) are problematic as they are sensitive to data and do not have easy interpretability. A simple equally weighted index is easy to comprehend, interpret, and replicate. Finally, although overall vulnerability is a handy summary, we recommend the use of an overall index alongside domain-specific vulnerability indices. For example, while planning to protect older citizens from infection, a demographic vulnerability index should be used to identify priority regions. Often, overall vulnerability masks the domain-specific vulnerability of a population, and users of our index should be mindful of this.
Despite the usefulness of the index, there are some limitations. Ideally, it would be possible to calculate the index at a sub-district level. However, several important variables used to define vulnerability were not available at a sub-district level. Hence, this analysis is restricted to the district level. Furthermore, at present, major planning and financing of the Indian Government response to the epidemic is concentrated at the state and district levels, meaning it makes sense to provide vulnerability data to these policy makers at district and state levels. Finally, data used in this study are 2–5 years old and might not have captured vulnerability well in districts in which rapid changes have occurred up to the present day.
In conclusion, the vulnerability indices reported in this study are intended to spatially identify vulnerable regions in India according to five different domains of vulnerability and help the community prepare for, mitigate, respond to, and recover from the epidemic. The fact that we were unable to study sub-district data to provide results for small-area planning calls for an overhaul of India’s data ecosystem. We recommend a national micro-level data framework for effective management of such disasters in the future.
RA conceptualised the manuscript. AP and RA did the literature search, collected data from public sources, and did all statistical analyses. RA mainly wrote the manuscript with contributions from AP. Both authors reviewed the manuscript and RA finalised it.
We declare no competing interests.