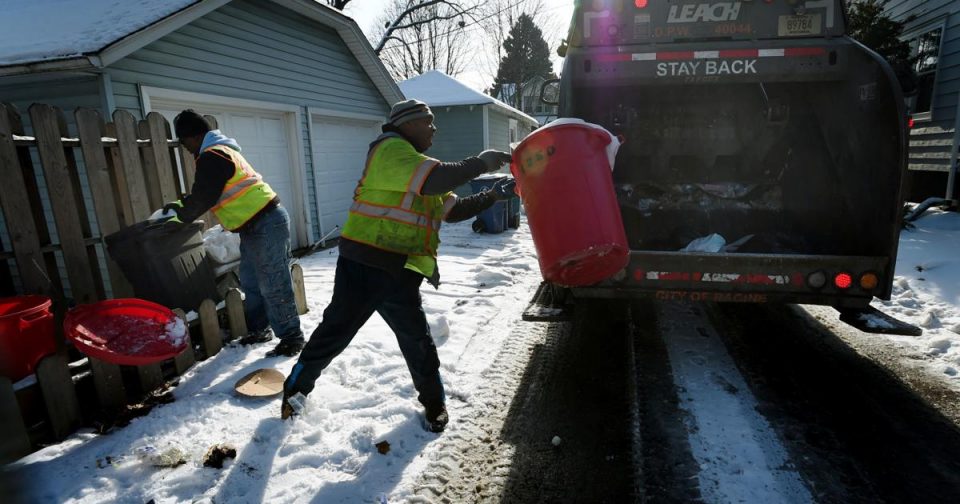
RACINE — With about a year to go before the Kestrel Hawk Landfill closes, the city is moving forward with a plan to handle the city’s trash and recycling without disruption to residents.
After analyzing their options, the City Council has decided the best way forward is to construct a transfer station.
The City Council voted on March 15 to contract with Foth Infrastructure & Environment, LLC to develop plans, specifications and estimates for design and interim planning for the construction of a city-owned transfer station.
This phase of the project will cost approximately $55,600.
Foth was contracted by the city for the first phase of the project, which entailed an analysis of the options the city had for the city’s trash. The company spent seven months collecting data in order to present the merits, costs, and disadvantages to four options.

Rooney
John Rooney, commissioner of the Department of Public Works, outlined the issues to the Committee of the Whole on March 15.
People are also reading…
“This is one of the biggest challenges facing the Department of Public Works and the city of Racine in the near future,” Rooney said.
One of those challenges is the landfill will certainly close, likely sometime in early 2023, before the city finishes the transfer station in fall.
During the interim, the city will have to haul the city’s trash to another landfill. Due to the distance, extra personnel and trucks will be needed, and the estimated cost of the temporary hauling is $70,000/per month.
The city manages approximately 28,000 tons of solid waste and 5,000 tons of recycling annually.
Station
The contract with Foth is just the first step in what could be a long process for constructing a city-owned transfer station.
Currently, trucks pick up the garbage and take it to the Kestrel Hawk Landfill, located at 1989 Oakes Road, the corner of Oakes and 16th Street.
As of 2018, the landfill was accepting about 600 tons of solid waste per day, which equals about 219,000 tons per year. Less than an eighth of that tonnage comes from the City of Racine.
Once the transfer station is completed, the city trucks will take the garbage there. A company contracted by the city will then pick up the garbage for disposal in a landfill, either one they own or one they contract with.
Municipal transfer stations are typically enclosed and are emptied out every day, which should cut down on concerns by neighbors about the smell.
The project would require about 2 acres of property, the cost of which would depend on the property.
The cost of construction for the building and necessary equipment — such as a scale, a large front-end loader and compactor — would cost close to $3 million.
Services
Although cost was an important consideration, the continuation of current services was also important.
Garbage trucks and other high-weight vehicles are considered to do most of the damage to Racine’s roads and especially to its alleys, according to Assistant Commissioner of Public Works John Rooney. That’s why he thinks that getting more vehicles off the road via increased public transportation wouldn’t make much of a difference to street quality, and why he’s open to the idea of getting rid of trash/recycling pickup in alleys.
In an interview, Rooney noted that very few municipalities continue to offer the services available to those in Racine.
Other municipalities have fully automated collection, he explained, with a side loader that allows drivers to stay in their vehicles. If there is extra material, an extra trash bag, it will probably not be picked up, he said.
In other places, if a person doesn’t get their cart to the corner early enough, public works is probably not going to circle back; whereas in Racine, if there’s a vehicle in the area they’ll swing back to get it, Rooney said.
“These little things people appreciate and have come to expect, those services could easily go away or become too expensive,” he said about some of the options that were before the council.
Rooney described the process of implementing both a temporary and permanent solution to the issue as having “a lot of moving parts.”
However, once it is done, it will carry the city through the next few decades, he added.
Options
The city considered a number of other options.
For example, Rooney said DPW approached Kenosha to see if there was any interest in a joint municipal transfer station, with trash hauled to a landfill in Kenosha, but that did not pan out.
Two of the four options presented by Foth included the privatization of the entire system, and the possibility of hauling the trash to a different landfill.
Both of those options were deemed too expensive.
Rooney explained there were six factors the city considered:
- Cost (capital costs and operational)
- Financial risk
- Operation impacts
- Timeline
- Impact on users
- Potential regulatory issues
However, the six factors were not given equal weight. Potential costs, for example, carried the greatest weight.
Currently, waste management costs $80 per parcel. That figure represents the $3.2 million cost and $1.1 million in revenue averaged out over 27,000 parcels.
The cost of any new system was compared to what the city is currently paying. Every single system examined represented a cost increase, some more than others.
As one example, to direct haul to a new landfill would increase costs to $117 per parcel, due primarily to the fact the trash would have to be hauled a further distance — requiring additional drivers and equipment.
Although the city would incur costs in building the transfer station, once built the operational costs would be approximately the same.
However, there will be a certain loss of revenue once the landfill closes. The city receives a host fee for having a landfill, for example, which approximates to $200,000.
DPW waste management has revenue from several sources. For example, waste management gets rent on the trucks used for leaf and yard waste pickup and employee costs.
What 60 years of data tell us about our garbage habits
What 60 years of data tell us about our garbage habits
America was built and continues to depend on a culture of consumerism—consumer spending makes up roughly 70% of the United States’ gross domestic product. Nowhere is this insatiable appetite for material things more apparent than in our garbage.
To find out how our trash habits, both individually and as a collective society, have changed over the past 60 years, Pela compiled data from the EPA on municipal waste estimates for various items between 1960 and 2018. For items such as food and yard waste, recycling includes municipal compost disposal.
On individual and collective levels, our generation and treatment of trash reflect our values. Americans generated 292.4 million tons of municipal solid waste in a single year—the equivalent of 4.9 pounds of trash per person per day, according to the most recent EPA data. Roughly 30% of this was recycled. The United States produces more waste per capita than any other country in the world, and among developed nations, it is the only country where waste generation outpaces recycling.
Trash generation in the U.S. has significant global implications. As a byproduct of the 2020 Trade Wars, China is no longer buying and importing America’s trash for recycling. According to the most recent Census data, China was importing an average of 429 shipping containers from the U.S. each day full of plastic alone. When you factor in other types of trash sent overseas, the number of containers jumps to 4,000 daily. In return, the U.S. received exports like aluminum, paper, and more plastic.
America’s trash continues to be exported overseas to Africa and Asia, but now to countries less capable of recycling or disposing of this waste in environmentally conscious ways. It is estimated that 51% of these exports are mismanaged, ending up in oceans, rivers, countrysides, and other natural resources.
Landfills are among the top emitters of methane gasses in the U.S. In 1960, 94% of total American waste ended up in our landfills. Regulatory practices like the 1976 Resource Conservation and Recovery Act and new waste treatment methods brought that number down to 50% in 2018. Some of that can be attributed to better management practices. Recycling and composting rates have increased by about 25 percentage points in the same period.
But it’s not all good news. While disposal methods of combustion and incineration may help alleviate the issue of landfill availability, and while it may also generate electricity, burning trash is significantly contributing to the climate crisis via greenhouse gas emissions. It is a practice facing a reckoning.
In municipalities across the country, particularly low-income areas, it is cheaper to dispose of recyclable trash by landfill or combustion than to recycle it properly, which would require raising taxes for already financially burdened residents.
Individuals alone can no longer solve this problem of excess. And according to a 2020 investigative report by NPR and PBS, when it comes to reducing plastic waste, they never could.
Stakeholders in the plastic industry have knowingly misled consumers about the viability of polymer recycling for decades; in doing so, even more plastic was sold under the promise that a product like a soda bottle will have a long life of reincarnated purpose. This is largely untrue. Polymer recycling is expensive and inefficient. From a business, and more specifically a cost standpoint, it’s significantly more advantageous to create virgin plastic instead of recycling what’s already in the trash stream. It is estimated that only 9% of all the plastic ever produced has been recycled with the rest ending up in landfills, incinerated, or polluting natural environments.
Being a conscientious consumer is an important starting point, and there is significant room for improvement. For example, individual consumers are responsible for most food waste generated in the United States, totaling between 30% and 40% of all food produced.
But the most significant share of responsibility to reduce waste falls on corporations worldwide. Just 20 companies create more than half of the world’s single-use plastic waste. Fast fashion brands produce tens of thousands of new lines every year, with most pieces discarded as textile waste. Oil companies are turning to plastic production amid a plastic crisis to buoy their profits. These are just a few examples of a global problem. Keep reading to learn more about how America’s garbage habits have changed since 1960.

Paper and paperboard
– Total waste generated 2018: 67.4 million tons (+124.7% change since 1960)
– Total sent to landfill: 17.2 million tons (25.6% of total waste generated, -30.9% change since 1960)
– Total recycled: 46.0 million tons (68.2% of total waste generated, +804.9% change since 1960)
– Total combusted: 4.2 million tons (6.2% of total waste generated, increase from 0 tons in 1960)
Paper and paperboard trash are some of the few glimmers of relative success in America’s waste management history. Materials with any type of food or liquid residue or plastic coating—think pizza boxes and milk cartons—cannot be recycled. But the paper products that can be recycled are most often turned into containerboard on their way to becoming cardboard boxes.
Demand for cardboard boxes is at an all-time high, particularly amid the coronavirus pandemic. The cardboard manufacturing industry generated over $67 billion in revenue in the first 10 months of 2020. Corporate giants like Amazon are also reducing paper and paperboard excess in the waste stream. Amazon eliminated the equivalent of 1.6 billion boxes-worth of packaging materials over five years by using artificial intelligence to determine the optimal packaging size.
Glass
– Total waste generated 2018: 12.3 million tons (+82.3% change since 1960)
– Total sent to landfill: 7.6 million tons (61.6% of total waste generated, +14.0% change since 1960)
– Total recycled: 3.1 million tons (25.0% of total waste generated, +2,960.0% change since 1960)
– Total combusted: 1.6 million tons (13.4% of total waste generated, increase from 0 tons in 1960)
Glass has a limitless lifespan: Its quality does not degrade with every melting and reconstituting. But the U.S. is among the worst countries when it comes to glass recycling rates. While many parts of Europe boast rates hovering around 90%, the U.S. has idled about 25% for the last several years.
Like so many other materials on this list, processing glass waste to a satisfactory state for producing cullet—crushed granular glass ultimately used for recycling—is expensive, inefficient, and hard to scale. Since many municipalities utilize single-stream recycling, contamination of materials makes them at best challenging to separate and at worst unusable and bound for landfills. Glass treated with reflective coatings or other materials are not recyclable.
Ferrous metals
– Total waste generated 2018: 19.2 million tons (+86.4% change since 1960)
– Total sent to landfill: 10.5 million tons (54.8% of total waste generated, +2.7% change since 1960)
– Total recycled: 6.4 million tons (33.1% of total waste generated, +12,620.0% change since 1960)
– Total combusted: 2.3 million tons (12.0% of total waste generated, increase from 0 tons in 1960)
Iron and steel constitute the ferrous metals category. An easy way to confirm ferrous vs. non-ferrous is by using a magnet: Ferrous metals will attract it. Some of the most common metal items or metal-containing items in this category that make it into the municipal solid waste stream are furniture, the inner workings of tires, and appliances.
With the increase of homeownership, purchasing power, and various industry expansions over the decades, these types of materials have become more prevalent in our trash. The EPA figures above do not include iron and steel from construction projects and large-scale transportation systems like ships and trucks. Ferrous metals can be recycled indefinitely. Steel and iron are typically less valuable to scrap dealers than various non-ferrous metals.
Aluminum metals
– Total waste generated 2018: 3.9 million tons (+1044.1% change since 1960)
– Total sent to landfill: 2.7 million tons (68.4% of total waste generated, +682.4% change since 1960)
– Total recycled: .7 million tons (17.2% of total waste generated, increase from 0 tons in 1960)
– Total combusted: .6 million tons (14.4% of total waste generated, increase from 0 tons in 1960)
Aluminum cans are America’s most successful recycling endeavor, thanks in large part to the Coors family—yes, the beer company. Unlike several materials on this list, recycling aluminum is far more efficient than simply just producing more. Recycling an aluminum can uses just 5% of the energy needed to create it. It can be recycled quickly and indefinitely, and according to the Aluminum Association, 75% of all aluminum ever produced is still in circulation. In 2018, beer and soda cans made up 50% of all the aluminum packaging that was recycled.
Other non-ferrous metals
– Total waste generated 2018: 2.5 million tons (+1294.4% change since 1960)
– Total sent to landfill: .7 million tons (29.5% of total waste generated, +311.1% change since 1960)
– Total recycled: 1.7 million tons (67.3% of total waste generated, increase from 0 tons in 1960)
– Total combusted: .1 million tons (3.2% of total waste generated, increase from 0 tons in 1960)
Lead, copper, and zinc are the most prevalent non-ferrous metals that make it into America’s waste stream and are most often found in the form of car, truck, or motorcycle batteries. Copper is the second-most recycled non-ferrous metal behind aluminum. Like glass, non-ferrous metals can be melted down and repurposed repeatedly without degradation. Consumers can make money by selling scrap metal to local scrap yards who will clean and repurpose the various ores and ensure these materials stay out of landfills.
Plastics
– Total waste generated 2018: 35.7 million tons (+9048.7% change since 1960)
– Total sent to landfill: 27.0 million tons (75.6% of total waste generated, +6815.4% change since 1960)
– Total recycled: 3.1 million tons (8.7% of total waste generated, increase from 0 tons in 1960)
– Total combusted: 5.6 million tons (15.8% of total waste generated, increase from 0 tons in 1960)
Recycling plastic is expensive and labor-intensive. This process is also challenging to scale to the degree that the world needs to reduce plastic waste significantly. With every regeneration of plastic, the material degrades. So, plastic producers have consistently resorted to creating more virgin plastic instead.
A majority of the plastic produced today, including bags, containers, bottles, cutlery, and packaging, is designed to be single-use. These items, used for mere moments, can take anywhere from 10 to 450 years to decompose. Experts anticipate this problem will only get worse. Many large fossil fuel companies like Exxon Mobil predict a decreased demand for oil and natural gas in the near future. To bolster profits, they are investing in the production of plastic, which is, of course, derived from natural gas and crude oil. The World Economic Forum expects plastic production to double by 2040.
Rubber and leather
– Total waste generated 2018: 9.2 million tons (+397.8% change since 1960)
– Total sent to landfill: 5.0 million tons (54.5% of total waste generated, +230.5% change since 1960)
– Total recycled: 1.7 million tons (18.2% of total waste generated, +406.1% change since 1960)
– Total combusted: 2.5 million tons (27.3% of total waste generated, increase from 0 tons in 1960)
Automobile tires are the most common rubber waste products. For maximum safety, car, truck, and motorcycle tires are disposed of after the treads are worn down to the point where traction is dangerously reduced. This renders a large portion of the original product, often in good condition, unusable. These worn tires can be recycled into scrap rubber and used to create mulch, agricultural equipment, and various surfaces like rubberized asphalt, playgrounds, and hospital floors.
The increase in rubber waste generated since 1960 can be attributed to greater purchasing power, more people owning cars, and the expanded trucking industry in response to a growing economy. Recycling of scrap tires peaked in 2013 with a 96% recycling rate. Since then, that number has fallen to 76% as innovative applications for recycled rubber have slowed.
Textiles
– Total waste generated 2018: 17.0 million tons (+867.6% change since 1960)
– Total sent to landfill: 11.3 million tons (66.4% of total waste generated, +560.8% change since 1960)
– Total recycled: 2.5 million tons (14.7% of total waste generated, +4,920.0% change since 1960)
– Total combusted: 3.2 million tons (18.9% of total waste generated, increase from 0 tons in 1960)
The rise in textile waste can be attributed mainly to the ascent of fast fashion and online shopping. Brands like Zara, H&M, and Fashion Nova are synonymous with cheap and trendy clothing. Fashion Nova releases roughly 1,000 new styles every week. Shein, another famous fast-fashion magnate, releases 1,000 new styles every day. Consumers have come to expect seemingly endless low-cost and on-trend clothing options from retailers. Because these options are produced using cheap materials, they aren’t designed to last. Some brands concerned about exclusivity have even burned unsold merchandise—up to $40 million worth in one case.
Clothing utilization has been declining over the last 20 years, with the average person wearing a garment less than 10 times before being discarded. Recycled clothing is often repurposed into rags and furniture filling or sent overseas.
Wood
– Total waste generated 2018: 18.1 million tons (+497.0% change since 1960)
– Total sent to landfill: 12.2 million tons (67.2% of total waste generated, +301.0% change since 1960)
– Total recycled: 3.1 million tons (17.1% of total waste generated, increase from 0 tons in 1960)
– Total combusted: 2.8 million tons (15.7% of total waste generated, increase from 0 tons in 1960)
Wood waste in the U.S. consists primarily of shipping pallets, crates, and some furniture. According to the Bureau of Labor Statistics, the price of wood shipping pallets is skyrocketing amid the global supply chain shortage. Industry experts are seeing a shift toward plastic pallets in response to these rising prices. The EPA does not include wood from construction and demolition projects in their municipal solid waste figures. Painted, stained, or chemically treated wood cannot be recycled, but uncontaminated lumber is recycled to make landscaping mulch or pulp for paper.
Food waste
– Total waste generated 2018: 63.1 million tons (+417.5% change since 1960)
– Total sent to landfill: 35.3 million tons (55.9% of total waste generated, +189.2% change since 1960)
– Total recycled: 2.6 million tons (4.1% of total waste generated, increase from 0 tons in 1960)
– Total combusted: 7.6 million tons (12.0% of total waste generated, increase from 0 tons in 1960)
According to a Natural Resources Defense Council report, individual consumers in America waste 40% of their food annually—the equivalent of 400 pounds of food per person per year. That’s roughly 50% more today than in the 1970s. We have an aversion toward food that looks imperfect, we buy more than we need, are served more than we can or should eat, and lose product at every stop along the supply chain.
As food waste decomposes in landfills, it produces methane, a harmful greenhouse gas that is significantly more potent than carbon dioxide and disastrous to the environment. Food waste is one of the top contributors to methane gas emissions. Initiatives like the Landfill Methane Outreach Program have been working with municipal solid waste stakeholders to reduce and harness the power of methane as an energy source. Limited data exist on the efficacy and long-term impacts of the efforts.
Yard trimmings
– Total waste generated 2018: 35.4 million tons (+77.0% change since 1960)
– Total sent to landfill: 10.5 million tons (29.7% of total waste generated, -47.4% change since 1960)
– Total recycled: 22.3 million tons (63.0% of total waste generated, increase from 0 tons in 1960)
– Total combusted: 2.6 million tons (7.3% of total waste generated, increase from 0 tons in 1960)
Grass, leaves, and tree trimmings from residential and commercial sources comprise the yard trimming municipal solid waste category. Like food waste, yard waste breaks down in landfills and emits methane into the atmosphere. Over the last several decades, many states have banned yard trimmings from being dumped in landfills to reduce greenhouse gas emissions. Recycled yard waste often ends up back in your yard in the form of a soil amendment like compost or mulch.
This story originally appeared on Pela and was produced and distributed in partnership with Stacker Studio.