The Tableau analytics and visualisation software is being widely used by Bairnsdale Regional Health Service in regional Victoria to improve operations and reporting.
Bairnsdale Regional Health Service (BRHS) business analyst Nick Fordham’s job includes data warehousing, BI, and reporting. Around four years ago, he was given a stack of Excel workbooks that had been managed by a couple of executives, with a request to “make it workable.”
Fordham picked Tableau for the task after taking advantage of the trial version. It was relatively intuitive to use, had a clear pricing structure, and (importantly where sensitive health data is concerned) could run on premises, he told iTWire.
The first part of the project was to improve the reporting of government-mandated KPIs. The goal was to provide daily rather than quarterly reports so the relevant decision makers could take prompt corrective action when necessary.

|
That was initially achieved by generating data extracts in CSV format, loading them into Tableau, and then sending the visualisations to users. This approach was not scalable, so Fordham automated the process of generating routine reports using Tableau Server and the BRHS data warehouse.
The refresh interval for reports and dashboards is now as little as two minutes, which means they can be used for operational as well as strategic purposes.
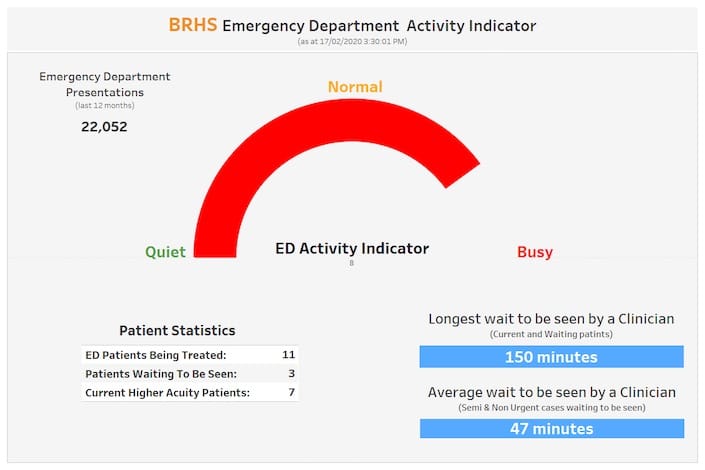
For example, the Aboriginal Health Unit is alerted within minutes of an Aboriginal or Torres Strait Islander (ATSI) patient presenting at the hospital. The unit also received a daily list of ATSI in-patients. These measures improves the care and support of such patients, as the AHU can now offer assistance instead of waiting to be asked for help.
Other alerts push various types of information to the relevant people according to data values. Examples include an alert when the hospital is 95% full, and a general alert when a triage level one (most critical, resuscitation required) patient presents so staff know not to unnecessarily bother their colleagues in the emergency department.

“Data cleansing was one of the surprising things to come out of alerts,” Fordham told iTWire.
For instance, the hospital’s operational system allows the entry of a patient transfer record without specifying the destination hospital. If such a record is created, Tableau generates an alert prompting the entry of the missing information.
Tableau is also used as part of the BRHS governance processes. Tableau reports of relevant information are generated for the appropriate people (with appropriate security controls), usually a week before committee or board meetings. Some of these bodies use the Tableau output as-is, while others incorporate it into their own reports.
Fordham noted that he has been invited to join several clinical committees as a result, which helps him understand requirements. It’s great to have an IT person on such bodies, he observed.
He started with a perpetual Tableau licence but subsequently switched to a subscription, currently including 100 viewer licences so almost all managers and team leaders can use it. The amount of his own time that is saved more than justified the cost. “It paid for itself straight up,” he said.
Now, whenever he sees someone using spreadsheets to collate information, he offers to automate the process for them. “It’s taken away the soul-destroying, repetitive tasks,” he said, and people have better things to do that enter data into spreadsheets.
Furthermore, the broad use of Tableau has led to increased efficiency by revealing areas that could be improved upon, such as timely starts for surgery.
It lets people working at the coalface see where the problems are, he said. “It’s given us the information we needed… without it, we’d be flying blind.”
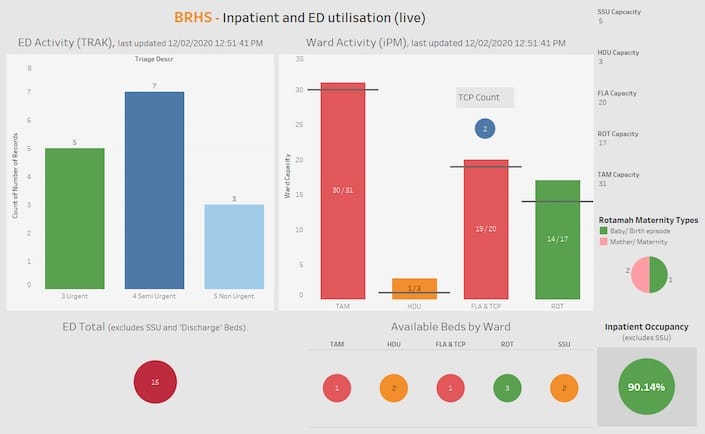
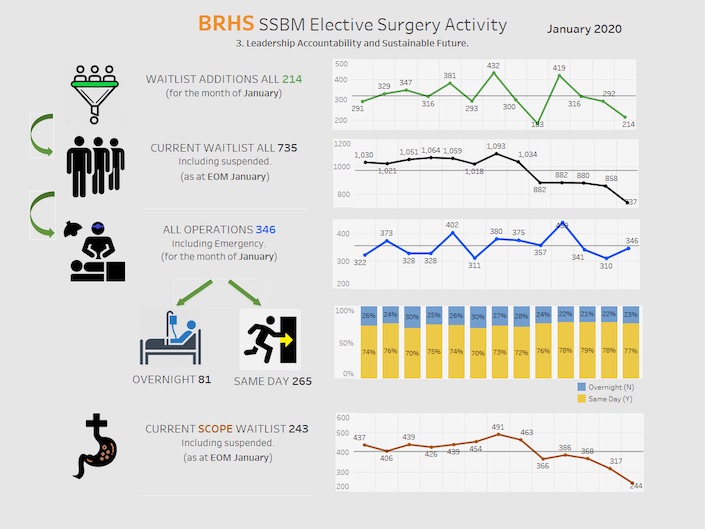
Tableau “has been well supported” within the service as it saves time for relatively senior staff.
“An efficient hospital is invariably a quality hospital from a clinical point of view,” he said. And BRHS staff want to be efficient because they are aware that they are spending public money.
Fordham’s task is far from complete, as he has identified so many additional uses for Tableau that it would take him about six months to implement them all even if that was all he focussed on.
CHIEF DATA & ANALYTICS OFFICER BRISBANE 2020
26-27 February 2020 | Hilton Brisbane
Connecting the region’s leading data analytics professionals to drive and inspire your future strategy
Leading the data analytics division has never been easy, but now the challenge is on to remain ahead of the competition and reap the massive rewards as a strategic executive.
Do you want to leverage data governance as an enabler?Are you working at driving AI/ML implementation?
Want to stay abreast of data privacy and AI ethics requirements? Are you working hard to push predictive analytics to the limits?
With so much to keep on top of in such a rapidly changing technology space, collaboration is key to success. You don’t need to struggle alone, network and share your struggles as well as your tips for success at CDAO Brisbane.
Discover how your peers have tackled the very same issues you face daily. Network with over 140 of your peers and hear from the leading professionals in your industry. Leverage this community of data and analytics enthusiasts to advance your strategy to the next level.
Download the Agenda to find out more