Pgiam/iStock via Getty Images
Investment Thesis
Here we tell why Star Bulk Carriers (NASDAQ:SBLK) investors need Risk/Reward ratio comparisons in 2022 far more than Price/Earnings ratios in 2025. ZIM Integrated Shipping Services Ltd. (ZIM) appears to be a better choice now.
Every investment involves a forecast of the future. Those forecasts must encompass the uncertainty of the future. The more future time is involved the larger the risk potential and the reward prospects. Both aspects should be compared to one another, and that balance accepted/rejected by the investor’s need and purpose.
Sciences of nature in the world around us operate in terms of accepted, evidenced rules of outcomes. Everything else is happenstance, and involves uncertainty. Many natural uncertainties appear to relate to “variables”.
When those variables themselves appear to lack forecast-able outcomes, as in investing, it often is because humans are involved. Humans, as sentient beings, are known to change their minds – and their rules of behavior.
That classifies such behaviors as “games” where “strategy” of behaviors becomes part of the game of “playing the players”. Games like WAR and INVESTING.
The players with the most (and best) resources have the best prospects of winning the game’s events. In the investing war, the advantage usually favors the institutions. They recognize that in the investing game the resources being invested are BOTH capital and time.
Because investing performance is measured over time (which cannot be replaced once spent) it needs respect when committed. Because uncertainty increases with time commitment, the astute investors are quick to adjust their strategies to recognize change.
This is why near-term price expectations need constant attention. Institutions have the resources to demand – and get – attention. They won’t wait for 4 years to find out a mistake was made.
Risk and Reward Balances
MM forecasts are of reasonable-to-expect price limits, both higher and lower. Their range, split by current market price, defines the balance of gain vs. loss prospects. Figure 1 shows those upper and lower limits of price change on the given date for each of the ocean shipping stocks identified by reader traffic on Yahoo and other internet services.
Figure 1
blockdesk.com
(used with permission)
Upside price rewards are from the behavioral analysis (of what to do right, not of errors) by Market-Makers [MMs] as they protect their at-risk capital from possible damaging future price moves. Their potential reward forecasts are measured by the green horizontal scale.
The risk dimension is of actual price drawdowns at their most extreme point while being held in previous pursuit of upside rewards similar to the ones currently being seen. They are measured on the red vertical scale.
Both scales are of percent change from zero to 25%. Any stock or ETF whose present risk exposure exceeds its reward prospect will be above the dotted diagonal line. Capital-gain attractive to-buy issues are in the directions down and to the right.
Our principal interest is in SBLK at location [12] and in ZIM at [9]. A “market index” norm of reward~risk tradeoffs is offered by SPY at [2]. Most appealing by this Figure 1 view is ZIM.
This map provides a good visual comparison of the two most important aspects of every equity investment. There are other aspects of comparison which this map sometimes does not communicate well, particularly when general market perspectives like those of SPY are involved. Where questions of “how likely’ are present other comparative tables, like Figure 2, may be useful.
Figure 2
blockdesk.com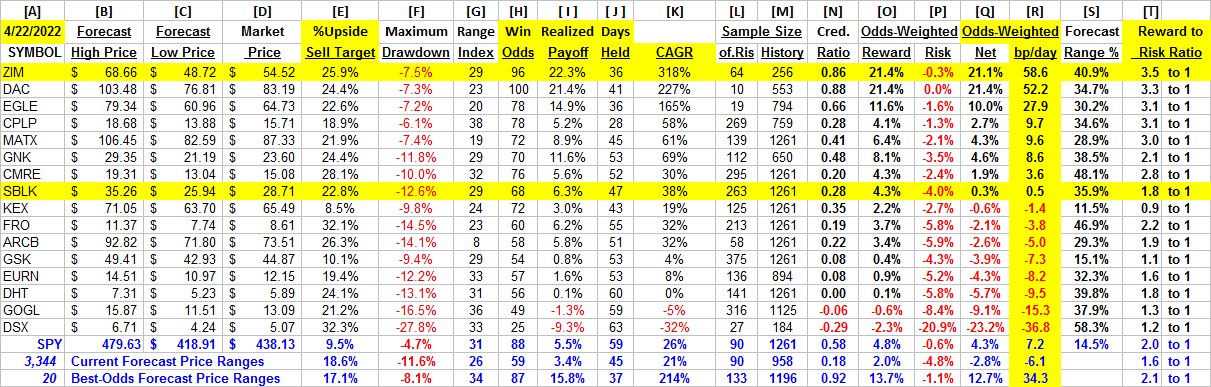
(used with permission)
Column headers for Figure 2 define investment-choice preference elements for each row stock whose symbol appears at the left in column [A]. The elements are derived or calculated separately for each stock, based on the specifics of its situation and current-day MM price-range forecasts. Data in red numerals are negative, usually undesirable to “long” holding positions. Table cells with yellow fills are of data for the stocks of principal interest and of all issues at the ranking column, [R].
Readers familiar with our analysis methods may wish to skip to the next section viewing price range forecast trends for SBLK.
Why do all this math?
Figure 2’s purpose is to attempt universally comparable answers, stock by stock, of a) How BIG the prospective price gain payoff may be, b) how LIKELY the payoff will be a profitable experience, c) how SOON it may happen, and d) what price drawdown RISK may be encountered during its holding period.
The price-range forecast limits of columns [B] and [C] get defined by MM hedging actions to protect firm capital required to be put at risk of price changes from volume trade orders placed by big-$ “institutional” clients.
[E] measures potential upside risks for MM short positions created to fill such orders, and reward potentials for the buy-side positions so created. Prior forecasts like the present provide a history of relevant price draw-down risks for buyers. The most severe ones actually encountered are in [F], during holding periods in effort to reach [E] gains. Those are where buyers are emotionally most likely to accept losses.
The Range Index [G] tells where today’s price lies relative to the MM community’s forecast of upper and lower limits of coming prices. Its numeric is the percentage proportion of the full low to high forecast seen below the current market price.
[H] tells what proportion of the [L] sample of prior like-balance forecasts have earned gains by either having price reach its [B] target or be above its [D] entry cost at the end of a 3-month max-patience holding period limit. [ I ] gives the net gains-losses of those [L] experiences.
What makes ZIM most attractive in the group at this point in time is its ability to produce earnings most consistently at its present operating balance between share price risk and reward. Credibility of the [E] upside prospect as evidenced in the [I] payoff is shown in [N].
Further Reward~Risk tradeoffs involve using the [H] odds for gains with the 100 – H loss odds as weights for N-conditioned [E] and for [F], for a combined-return score [Q]. The typical position holding period [J] on [Q] provides a figure of merit [fom] ranking measure [R] useful in portfolio position preferencing. Figure 2 is row-ranked on [R] among alternative candidate securities, with ZIM in top rank.
Along with the candidate-specific stocks these selection considerations are provided for the averages of some 3300 stocks for which MM price-range forecasts are available today, and 20 of the best-ranked (by fom) of those forecasts, as well as the forecast for S&P500 Index ETF (SPY) as an equity-market proxy.
As shown in column [T] of figure 2, those levels vary significantly between stocks. What matters is the net gain between investment gains and losses actually achieved following the forecasts, shown in column [I]. The Win Odds of [H] tells what proportion of the Sample RIs of each stock were profitable; 91% by ARWR, 68% by EXAS, and 69% by AMGN. Also contributing is the size of [I], with ARWR some 3x the size of AMGN and larger than EXAS, yet far more often reached as profitable. .
Description of the principal subject
“Star Bulk Carriers Corp., a shipping company, engages in the ocean transportation of dry bulk cargoes worldwide. The company’s vessels transport a range of major bulks, including iron ores, coal, and grains, as well as minor bulks, such as bauxite, fertilizers, and steel products. As of December 31, 2021, it had a fleet of 128 vessels with an aggregate capacity of approximately 14.1 million deadweight tons, including 17 Newcastlemax, 24 Capesize, 7 Post Panamax, 41 Kamsarmax, 2 Panamax, 20 Ultramax, and 17 Supramax vessels. The company also provides vessel management services. Star Bulk Carriers Corp. was incorporated in 2006 and is based in Marousi, Greece.”
Source: Yahoo Finance
Yahoo Finance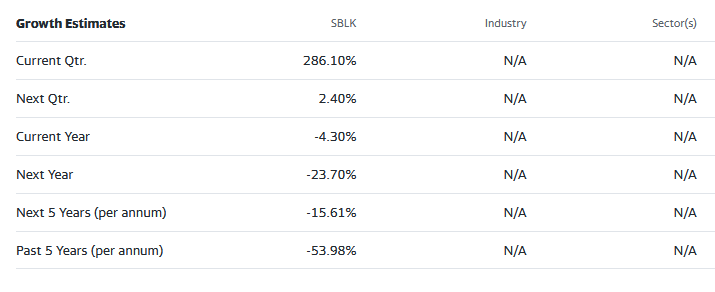
Description of Alternative Investment
“ZIM Integrated Shipping Services Ltd., together with its subsidiaries, provides container shipping and related services in Israel and internationally. It provides door-to-door and port-to-port transportation services for various types of customers, including end-users, consolidators, and freight forwarders. The company also offers ZIMonitor, a premium reefer cargo tracking service. As of December 31, 2021, it operated a fleet of 118 vessels, which included 110 container vessels and 8 vehicle transport vessels, of which four vessels were owned by it and 114 vessels are chartered-in; and network of 70 weekly lines. The company was incorporated in 1945 and is headquartered in Haifa, Israel.”
Source: Yahoo Finance
Recent Forecast Trends of Primary Subject
Figure 3
blockdesk.com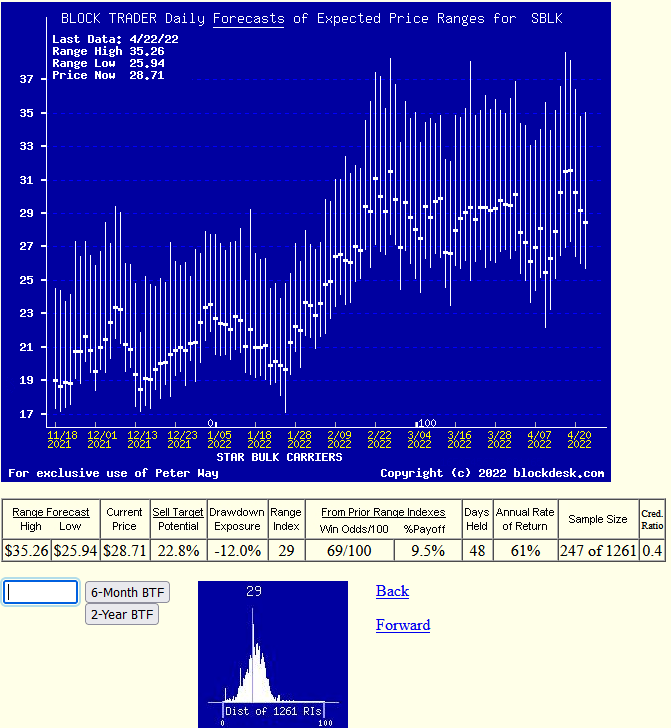
(used with permission)
Many investors confuse any picture of time-repeating stock prices with typical “technical analysis charts” of past stock price history. Instead, Figure 1’s vertical lines are a daily-updated visual forecast record of price range limits expected in the coming few weeks and months. The heavy dot in each vertical is the stock’s closing price on the day the forecast was made.
That market price point makes an explicit definition of the price reward and risk exposure expectations which were held by market participants at the time, with a visual display of the vertical balance between risk and reward.
The measure of that balance is the Range Index (RI). Here, only 29% of the full forecast range of from $35 to $26 is downside from $29, leaving a much larger 71% of the range to the upside.
Having such precise price expectation measures makes it much easier to make direct comparisons between all securities at each point in time, as was done in Figure 1.
The recorded histories of price range forecasts make it possible to understand how well each security performed in subsequent markets. It also reinforces under what Risk~Reward balance circumstances better forecasts were able to be made in the past and as in Figure 2, may be made at present for the future.
For contrast, lets’ look at this dimension of ZIM’s Block Trader Forecast picture next.
Figure 4
blockdesk.com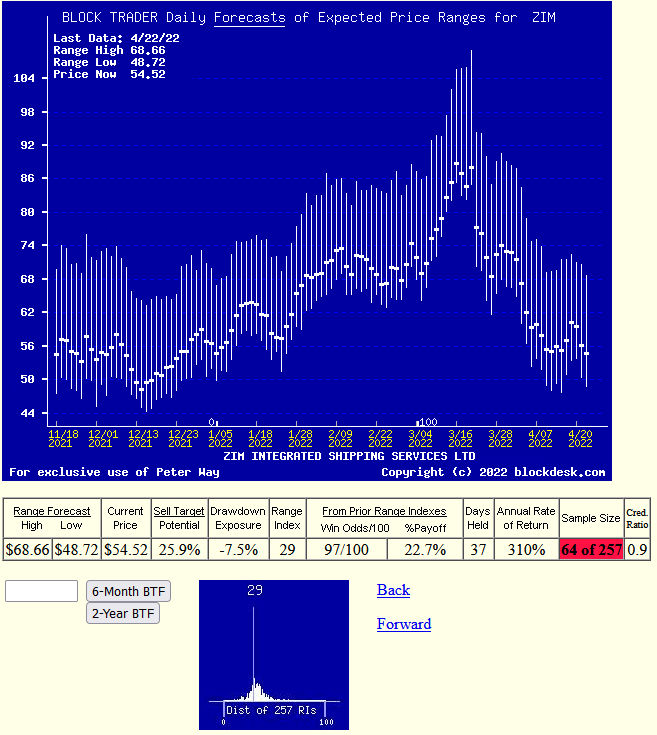
(used with permission)
This picture shows a present Range Index of 29, the same at SBLK. That may sound competitive, but Figure 2 column [S] measures ZIM’s forecast range size at 40%, while SBLK’s is estimated by MMs at only 35%.
More significantly, ZIM’s larger potential is more likely to be realized. The Figure 2 [N] credibility ratio measuring the [I] Realized Payoff of prior ZIM forecasts like today’s as a percentage of the upside target [E] is 86%. The same measure of SBLK is only 28%, and in the actual [I] amounts, only a net gain of 6.3% while ZIM captured gains of 22.3%.
It turns out that 96% of ZIM forecasts earned profits while SBLK scored gains in only 68%, the “Win Odds” of Figure 2 [H].
The combined effect of these interrelationships produced a reward to risk ratio [T] of 3.5 to 1 for ZIM and only 1.8 to 1 for SBLK.
Better could be a bigger payoff, in ZIM sooner, producing a many times larger, a 310% Compound Annual Growth Rate [CAGR] for the portfolio.
Conclusion
The notion of “which investment today?” is being answered by Institutional Investor circles saying that ZIM Integrated Shipping Services Ltd. is the best capital gain opportunity in the Ocean Shipping set.