To analyse the impact of EV utilization patterns and household behaviour on potential emissions advantages, we first leverage a nationally representative dataset to quantify household vehicle ownership trends and aggregate utilization levels. After determining the number of vehicles owned by households, as well as the proportion of miles travelled by single- and multi-vehicle households, we analyse emergent procurement and utilization patterns and construct four representative scenarios (Fig. 1 and Table 1). Given existing policy’s emphasis on incentivizing new, rather than used, EV purchases, we focus our analysis on households procuring new EVs.
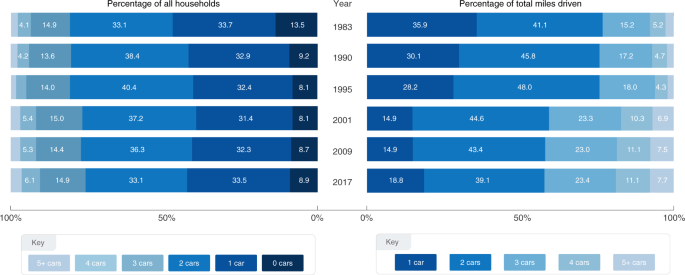
Historical automotive trend data.
We subsequently use existing data (Methods and Supplementary Information) to inform our model of requisite behaviours to achieve an EV emissions advantage. Specifically, we estimate the aggregate utilization (miles travelled over the vehicle’s lifetime) and longevity (measured in years of ownership) required for EVs to reduce emissions relative to each counterfactual, considering vehicle status and existing utilization trends. Additional details of our approach are available in Methods and Supplementary Information.
Our analysis yields two key findings. First, like previous work, we find that acquiring an emissions advantage requires that EVs exceed specific aggregate utilization thresholds11. However, building on previous work, we document that the stringency of these thresholds—how many miles the EV must cover over its lifetime to attain and maintain a ‘green lead’—depends on the specific counterfactual considered. Our model estimates that less stringent utilization thresholds (28,069 miles) are required of households that either (1) do not currently own a vehicle and would (absent an available EV) purchase an ICEV (scenario 1, Fig. 2a) or (2) currently own an ICEV and would (absent an available EV) purchase another ICEV as a second, complementary vehicle (scenario 3, Fig. 2c).
Conversely, more stringent thresholds (68,160 miles) are required in households that either (1) currently own an ICEV and would (absent replacing that vehicle with a new EV) continue to drive the ICEV (scenario 2, Fig. 2b) or (2) currently own two ICEVs and would (absent replacing the second ICEV with an EV) drive the ICEVs already in inventory (scenario 4, Fig. 2d). More stringent utilization profiles are attributable to counterfactual-specific characteristics: absent EV procurement, the household would drive their existing ICEV(s). Since emissions associated with manufacturing that/those ICEV(s) have already been produced, their presence is realized in both the EV procurement scenario and the counterfactual. During comparative analysis, these emissions cancel out, producing a ‘write off’ for ICEV-specific manufacturing emissions.
Counterfactual decisions to either purchase a new ICEV or continue to drive an existing one do not necessarily describe two separate demographics. A household may, over time, transition from one group to another. For example, if an ICEV has not yet reached the end of its usable life, the household may choose to continue driving it were a new EV unavailable. However, once that ICEV can no longer satisfy any portion of the household’s travel demand, the household would seek out a new EV and (absent an available EV) purchase a new ICEV. By considering both decisions, we show how the stringency of our thresholds also partially depends on when the incentive is realized and how it coincides with the current lifespan(s) of the household’s existing vehicle(s).
Our second finding is that counterfactual vehicle inventory (a seldom discussed parameter to our knowledge) influences the likelihood of achieving the aforementioned thresholds. Consider that although the requisite utilization threshold imposed by scenario 1 is identical to scenario 3 (28,069 miles), the requisite longevity (how many years the EV must remain in service to deliver an emissions benefit) is different: 2.73 versus 4.32 yr, respectively. Similarly, scenarios 2 and 4 impose different requisite longevity requirements (6.62 and 10.49 yr, respectively) despite having the same utilization threshold (68,160 miles). Increased requisite longevity in scenarios 3 and 4 reflects lower annual (versus aggregate) utilization of the second vehicle.
Our model does not specifically discern why ‘second vehicle’ longevity thresholds are higher. This lack of specificity is intentional. Second vehicles may be driven less because they are EVs5,6. But lower mileage may also be the product of vehicle status12. Our analysis of the US Department of Transportation’s National Household Travel Survey (NHTS) data (Fig. 1) further supports this claim, as additional vehicles are associated with declining marginal miles travelled (Supplementary Table 1). Households with more vehicles in inventory also not only travel more but they often put more miles on their most-used (primary) vehicle compared with households with fewer vehicles13. Consequently, even if EVs demonstrated equivalent annual utilization as ICEVs14, a reflection of envisioned improvements in battery technology and recharging infrastructure, EVs would—when relegated to secondary vehicle status—still need to remain in service for longer than their primary vehicle counterparts.
Collectively, these results hint at a paradoxical finding: using EVs as substitutes, not complements (particularly in multi-vehicle households) may produce more onerous preconditions for realizing an emissions advantage. This finding challenges the efficacy of existing EV policy proposals, whose underlying intent is to incentivize EV purchases as substitutes.
Implications for policy
Our findings have important implications for EV-dependent sustainability frameworks. A key tenet of these frameworks are procurement incentives, government-sponsored financial programmes, directed in large measure towards non-commercial vehicle owners to encourage ‘electrification’. Intuitively, such policies may make sense. In the United States, for example, privately owned cars, vans and light-duty trucks are responsible for most vehicle miles travelled and, by consequence, the greater part of transportation-related emissions15. Incentivizing these owners to use EVs instead of ICEVs offers substantial carbon emissions reduction opportunities. However, our model estimates that achieving ‘green leads’ could—under certain conditions—be challenging.
We observe that using EVs as the non-primary vehicle increases the longevity thresholds required for these vehicles to deliver an emissions benefit. This finding is noteworthy because the number of multi-vehicle households in the United States has increased substantially over the years16. Although this increase has been accompanied by rising vehicle ownership duration, the observed length of new vehicle ownership (6.61 yr) falls far short of the requisite longevity (10.49 yr in scenario 4) for EVs to deliver an emissions benefit during its first ownership period17. Moreover, because our requisite longevity estimates denote the number of years that must elapse before an EV can deliver an emissions advantage over the counterfactual procurement scenario (namely, driving an ICEV), failing to achieve these estimates could make driving an EV worse than driving an ICEV.
Given these findings, how should governments respond? Existing EV procurement incentive programmes direct sizable financial relief towards first adopters. A willingness to purchase a new EV is almost universally accompanied by government support, a reflection of the belief that incentives should be applied at the initial point of sale, not afterwards18. Our results suggest a more targeted approach is warranted, one that considers EV usage patterns and user behaviours. Incentive programmes should, where possible, account for counterfactual vehicle inventory and adjust incentive magnitudes accordingly. This may be achieved by transitioning away from incentive programmes that reward EV adoption to programmes that reward utilization, such as subsidized charging costs and/or vehicle maintenance fees.
Such an approach is timely given that governments have limited capital and must, given competing priorities, judiciously allocate that capital. In the United States alone, publicly held debt is projected to rise from 102% of gross domestic product in 2021 to 202% in 205019. Similar debt accumulation—and by consequence, fiscal anxiety—is projected globally without changes in current tax rates or government benefit programmes. Consequently, taxpayer-funded investments must prioritize return maximization. Our approach reflects this reasoning, with an emphasis placed on revenue-neutral adjustments to existing EV procurement incentive policies. Our model estimates that this outcome is more likely to be realized when counterfactual household inventory is considered over the current one-size-fits-all approach.
A more targeted vehicle electrification policy may be viewed as a weakened response to the threat posed by transportation-related emissions. We caution against the adoption of such reasoning. While there is broad consensus on the need to reduce carbon emissions, financing these efforts entirely using taxpayer funds remains unlikely due to the worsening debt outlook, capital intensity of indefinite subsidies and public resistance towards federal subsidies20. Hence, it is important—for reasons of political practicality—that public spending programmes be diligent and deliberate, maximizing emission benefits per dollar spent.
Adjusting the magnitude of EV procurement incentives also matters for reasons of socioeconomic equity. Our model estimates higher requisite longevity thresholds in multi-vehicle households. These households are typically characterized by high income and, by consequence, are less likely to keep new vehicles in inventory for long periods of time21. As the requisite longevity threshold among households in scenario 4 exceeds current first ownership durations17, realizing an EV’s emissions advantage in these households necessitates dependence on secondary EV adopters, individuals who are more likely to belong to low-income households21. EV procurement incentive programmes should reflect this reality, with some government support—initially targeted toward first adopters—being explicitly (re)directed towards second-hand EV owners22. Doing so would also alleviate concerns surrounding the regressive nature of existing EV procurement incentive programmes23.
Limitations
We conclude by acknowledging that our analysis has limitations. Uncertainties regarding the phasing out of fossil fuel-powered electricity grids, reductions in EV production emissions and projected changes in vehicle energy consumption profiles (to name a few factors) can (and will) affect the stringency of our estimates.
Regarding phasing out of fossil fuel-powered electricity grids, existing literature demonstrates that future reductions in electricity grid carbon intensity are plausible24,25,26. However, our sensitivity analysis (Supplementary Section V) demonstrates that the resulting reductions in EV fuel production emissions may, all other things being equal, prove insufficient in facilitating an emissions advantage among certain households. Realizing emissions benefits from EVs instead probably requires—our analysis suggests—reducing emissions from both fuel production and vehicle manufacturing, as simultaneous improvements to both factors generate highly elastic reductions to the requisite longevity and aggregate utilization thresholds of EVs.
Our longevity threshold estimates also depend on the annual utilization of EVs. Given uncertainties about utilization of EVs relative to that of ICEVs5,6,8,27, some caution is warranted when interpreting our findings. Increased EV utilization (relative to equivalent ICEVs) would produce less stringent longevity thresholds and vice versa. Likewise, increases in annual vehicle utilization (a potential consequence of improvements to charging infrastructure and EV range) would produce less stringent longevity thresholds (Fig. 2a–d). However, there is little evidence suggesting that EVs are used as primary vehicles in households that also own ICEVs. Conversely, a lack of consistent evidence persists with regard to fuel efficiency changes across a vehicle’s lifespan28,29. Hence, our model assumes a constant fuel efficiency throughout the lifespans of EVs and ICEVs.
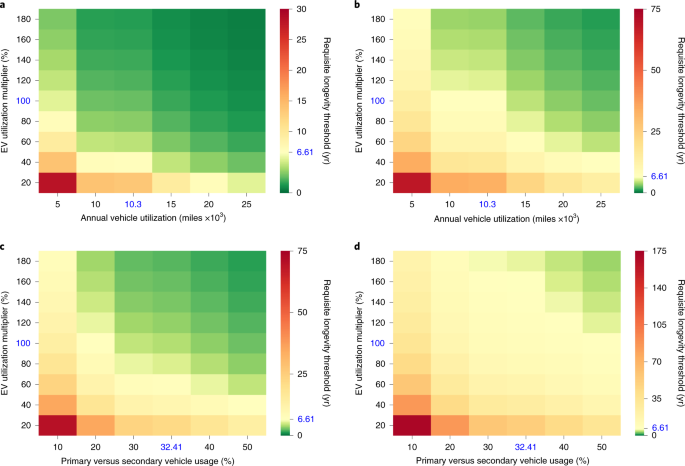
a, Scenario 1: requisite EV longevity threshold (yr) to achieve the 28,069 mile requisite aggregate utilization threshold. Blue text represents current EV utilization multipliers (the proportion of miles EVs cover compared to equivalent ICEVs), annual vehicle utilization and new vehicle ownership duration. Red shades denote conditions wherein estimated requisite longevity exceeds trends observed today. b, Scenario 2: requisite EV longevity threshold (yr) to achieve the 68,160 mile requisite aggregate utilization threshold. Blue text represents current EV utilization multipliers (the proportion of miles EVs cover compared to equivalent ICEVs), annual vehicle utilization and new vehicle ownership duration. Red shades denote conditions wherein estimated requisite longevity exceeds trends observed today. c, Scenario 3: requisite longevity threshold (yr) to achieve the 28,069 mile requisite aggregate utilization threshold. Blue text represents current EV utilization multipliers (the proportion of miles EVs cover versus equivalent ICEVs), primary versus secondary vehicle utilization percentage and new vehicle ownership duration. Red shades denote conditions wherein estimated requisite longevity exceeds current trends. d, Scenario 4: requisite longevity threshold (yr) to achieve the 68,160 mile requisite aggregate utilization threshold. Blue text represents current EV utilization multipliers (the proportion of miles EVs cover versus equivalent ICEVs), primary versus secondary vehicle utilization percentage and new vehicle ownership duration. Red shades denote conditions wherein estimated requisite longevity exceeds current trends.
These parameters warrant consideration when assessing the effectiveness of EV procurement incentive programmes, as does the extent to which our findings generalize across other markets.
Nevertheless, the robustness of our results suggests that existing incentive programmes should—given limited capital—be redesigned to realize EV-related emissions benefits more fully. We argue that the existing structure of EV subsidies, which predominantly favours new vehicle adoption, is not only less likely to deliver envisioned emission benefits than policies that incentivize longer EV retention but may also produce regressive results, directing financial relief away from households that are (1) more likely to need it and (2) more likely to facilitate realization of an EV’s emissions advantage. Failure to acknowledge and address this reality risks further exacerbating climate and societal inequities.