
Data collection process
We used a multistage random sampling procedure to identify the research location. In the first stage, we randomly selected the study area, the Rajshahi division, among Bangladesh’s eight administrative divisions. One of the administrative districts, Chapainawabganaj, was then randomly selected among the eight districts of the Rajshahi division. In the third stage, four administrative sub-districts (Upazila in Bangladesh) were selected randomly out of the five sub-districts. In the final stage, eight secondary schools (four located in the urban area and the other four in the rural area) were randomly selected with the help of key informants to locate the schools., The target sample size was 589 adolescent girls in order to detect 10% prevalence of use of sanitary pad (based on the 2014 Bangladesh National Hygiene Baseline Survey) at a 95% confidence interval, 5% non-response rate, and 1.5 design effect for homogeneity among learners sampled from the same school. The current cross-sectional study was conducted on 17–25 November 2018 among adolescent girls aged 14 to 19 years studying in eight secondary schools in the Rajshahi Division of Bangladesh. In each school, an average of 37 adolescent girls (total sample divided by two classes of each school) in Standards 9 and 10 were randomly selected from the registrar. The initial target was to have 60% of the sample from rural areas and 40% from urban areas, as most (more than 60%) of the population lives in rural areas. However, the final sample size stands at 586 adolescent girls comprising 57% from rural areas and 43% from urban areas (Fig. 1).
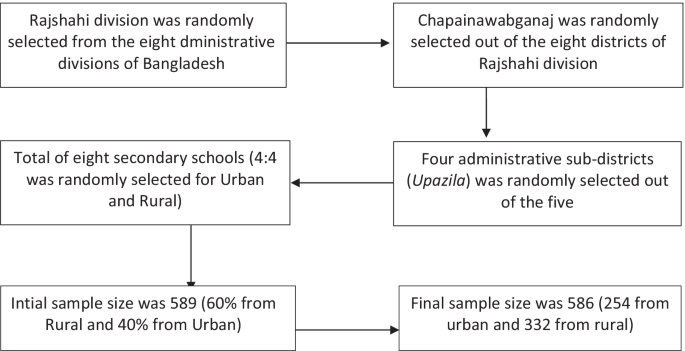
Process of sample selection for the study
Adolescent girls studying in Standard 9 and 10 were targeted; they were considered mature enough to talk about a socially sensitive issue like menstruation and could provide their consent for participation in the research. Before the commencement of data collection, permission was obtained from the head of each school over the phone after informing the study’s objectives. As permission was received, we collected detailed information of the potential respondents from those schools, randomly selected them, contacted their parents, and managed to receive their permission as the potential participants were minors. After getting permission from both heads of institutions and parents, one of the female teachers from each school was trained on the data collection process to oversee. On the interview day, randomly selected girls from Standard 9 and 10 were gathered in a classroom and were seated in-class environment. A questionnaire was given to students who voluntarily agreed to participate in the study after a short description of objectives and roles as respondents. After that, participants self-administered the questionnaire. The responsible female teacher collected the completed questionnaires.
Variable definitions and measurements
Outcome variable
The dependent variable, “Menstrual Hygiene Management Practice (MHMP),” had three categories, namely ‘good,’ ‘fair,’ and ‘bad.’ A total of 8indicators, identified based on existing literature [7, 12, 15,16,17,18,19,20], were used to measure menstrual hygiene management practices (Table 1).
For measurement purposes, healthy practices for each indicator were coded one, and unhealthy practices as zero. The first indicator was related to absorbent use for managing menstrual blood, where the use of sanitary pads and new cloth was regarded as healthy practices. However, the questions on washing cloth before re-using, materials used to a washcloth, place of drying and storing washed cloth (indicators 2.1 to 2.4 in Table 1) were only asked those who used the cloth to manage their menses [12, 19,20,21]. The positive response of all the four indicators about using old cloth was also considered healthy practices for indicator one. The other seven indicators included frequency of changing absorbent, washing of genitalia during menstruation, frequency of washing genitalia, the material used for washing genitalia, taking a bath during menstruation, frequency of bathing during menstruation, and ways of disposal of sanitary materials [7, 12, 15,16,17,18,19,20] and were applicable for all participants. Therefore, a score for the sum of eight indicators was used to measure MHM practices, with values ranging from zero to eight. The indicator was then categorized into bad (score of zero to five: up to 50%), fair (score of six: 50–75%), and good (score of seven and eight: 75–100%) MHM practices.
Predictors
Socioeconomic and demographic variables were used as the independent variables, including age, family size, religion, wealth index, fathers’ and mothers’ education, fathers’ and mothers’ income, age of first menstruation, social connectivity, and information on menstruation before reaching menarche based on the existing literature [1, 10, 12, 15, 19, 21,22,23,24,25,26,27,28,29]. Age was categorized as ≤ 15 and ≥ 16 years old considering the year of schooling (class 9 and 10) and mean age (15.1) of the participants. Since mother and other female relatives were the primary sources of information on menstruation in Bangladesh [8], adolescent girls from small families may have a lower chance of receiving menstrual information; as the number of female relatives tends to be lower in these families. Thus, we decided to assess the relation between family size and menstrual hygiene management. Families with five or fewer members were defined as small, and more than five members as large families based on the average family size (4.4) in Bangladesh [30].
We used ten items on household possessions to generate an indicator of an individual’s family wealth status. Questions included flooring type of the respondent’s household, electricity connection, steel/wooden Almirah, smartphone, toilet, type of toilet, color television, refrigerator, air conditioner, and availability of transport used for a non-business purpose. All variables had binary responses (yes or no) except the type of toilet and transport. Positive responses were assigned value one, and negative answers were attributed zero. Type of toilet facility and transport were recoded into dummy variables. The availability of a motorcycle and/or cars/micro/bicycle was considered a positive response. Similarly, the availability of open and/or kancha (mud) toilets was considered a negative response, while sanitary toilets (with or without water slab) were considered a positive response. One was attributed for both variables for a positive response and zero for a negative response. The principal component analysis (KMO = 0.71) was used to measure the wealth index and categorized poor (bottom 40%), middle (next 40%), and rich (top 20%) following existing literature [24].
The perceived socioeconomic class was measured by two questions that asked participants about their perceptions of the specific class to which they belonged, with the response of very poor, poor, middle, upper, and uppermost. For analytical purposes, those who responded very poor and poor were assigned value one, the middle was attributed two, and the upper and uppermost were attributed three. The two variables were then summed to generate a variable with values ranging from two to six. Respondents attaining value 1–2 were defined as low, 3–4 as middle, and 5–6 were defined as a high socioeconomic class. As existing literature suggests, although there is a high unmet need for sanitary pads, many adolescent girls and women do not use them because of high costs [8]. At the same time, many women and adolescent girls still consider sanitary pads as a luxury item [31]. Thus, we incorporated this variable to assume that perceived socioeconomic class may affect sanitary pad use and other menstrual hygiene management practices. We also measured the fathers’ income as low (up to BDT 10,000), middle (BDT 10,001 to 20,000), and high (BDT 20,001+); mothers’ income as yes and no.
We used three variables to measure respondents’ social connectivity: physical mobility, passing the time with friends outside the school, and internet use. Respondents who could travel more than one kilometer alone from home during the daytime without parental consent were defined as physically mobile, and those who could travel less than one kilometer as non-mobile. We considered a minimum distance of one kilometer based on the assumption that sanitary pads may not be available within this one square kilometer area, thus limiting the chance of buying sanitary pads by respondents themselves. Physical mobility was attributed value one, and non-mobility was attributed zero. Similarly, passing the time with friends other than school period and using the internet regularly had two possible responses; yes and no; positive answers were assigned value one, and negative answers were assigned zero. The three variables were summed to generate a score with values ranging from zero to three. Those who scored zero were considered not socially connected, those with 1–2 as moderately connected, and those scoring three as highly connected.
Respondents’ perception towards pad use was measured using a set of four statements: (1) use of old clothes rather than pads to manage menses may increase the risk of reproductive tract infections, (2) use of sanitary pads to manage menses may prevent reproductive tract infections, (3) use of sanitary pads helps to regular menstruation, and (4) use of sanitary pads protects one from the fear of unwanted drop out of it. Each statement had five options; strongly agree, agree, do not know/not sure, disagree, and strongly disagree. Responses ‘agree’ and ‘strongly disagree’ were coded as positive responses, while the rest were negative responses.
Analytical approach
We used cross-tabulation with the Chi-square test to examine urban–rural differences in various menstrual hygiene practices. We then estimated a multinomial logistic regression model to examine the factors associated with hygiene management practices. The results from cross-tabulations are presented as percentages, while those from multinomial logistic regression analysis are presented as [coefficient estimates/relative risk ratios (RRR)] with 95% confidence intervals (CI).