peshkov/iStock via Getty Images
Written by Nick Ackerman, co-produced by Stanford Chemist
Nuveen Real Asset Income and Growth Fund (JRI) is a rather unique real asset fund in that it takes a multi-asset approach. It invests across equity, preferred, and fixed-income investments across the credit quality spectrum. They are further diversified by investing across small, mid, and large-cap exposures.
The energy exposure of the fund primarily through pipeline companies has meant that the fund has held up materially better than the broader market. Below is a YTD performance comparing JRI with the SPDR S&P 500 Trust ETF (SPY).
YCharts
Notably, the total NAV returns have been significantly better, but the actual share price returns have been much closer. That had opened up JRI’s discount even further than when we last covered the fund. I believe this continues to represent a fairly attractive place to put capital to work.
The real assets should mean they also have some built-in natural inflation hedge. Working against that would be the fund’s fixed-income exposure that higher rates can negatively impact. That being said, the fund’s duration is 1.64 years – meaning that the impact isn’t going to be overly concerning.
The Basics
- 1-Year Z-score: -2.73
- Discount: -12.28%
- Distribution Yield: 8.04%
- Expense Ratio: 1.76%
- Leverage: 29.97%
- Managed Assets: $660.4 million
- Structure: Perpetual
JRI seeks “to deliver a high level of current income and long-term capital appreciation by investing in real asset-related companies across the world and the capital structure, including common stocks, preferred securities, and debt.” They define real asset-related companies as “those engaged in owning, operating, or developing infrastructure projects, facilities, and services, as well as REITs.”
Further, they invest “up to 40% of its assets may be debt securities, all of which may be rated below investment grade, though no more than 10% of its assets may be invested in securities rated CCC+/Caa1 or lower at any time. Non-U.S. exposure represents 25% to 75% of the Fund’s managed assets.”
As we mentioned above, this means they are quite flexible to invest where they see fit, as long as it is within the “real asset” space. The real asset space can be quite broad in itself, which includes real estate/REITs and infrastructure plays through midstream companies and utility companies.
The fund’s leverage is on the high end, as well as the fund’s expense ratio. Both of these things should be considered before investing in JRI. When including leverage expenses, the total expense ratio comes to 2.10%. The higher leverage has meant forced deleveraging in the previous 2020 market collapse. So even though this fund has about 50% in equity positions and 50% in preferred/debt holdings, that positioning hasn’t been defensive enough to save the fund in a collapse.
Performance – Attractively Valued
Historically, the fund has provided weaker returns for shareholders. The exposure to energy has hurt them in the past but has been helping them more lately as oil prices were surging. On top of this, since the fund takes a diversified approach to invest in tangible assets, the fixed-income exposure has meant more muted returns than other equity-heavy funds.
JRI Annualized Returns (Nuveen)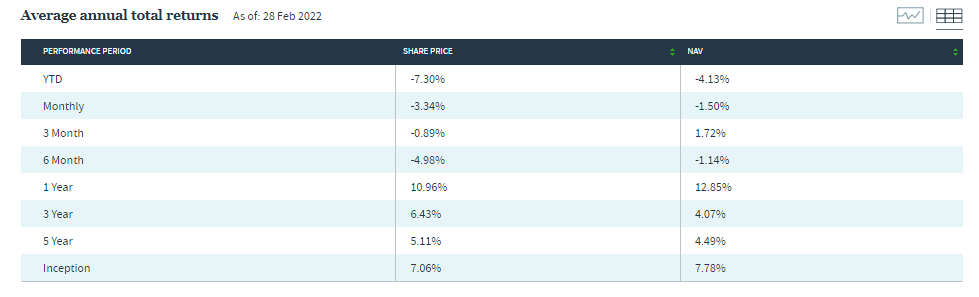
Going forward, I believe the more attractive features of the fund for better performance are based on getting the fund at a deep discount at the moment. This is on top of the fund’s positioning and holdings being attractive on their own.
More recently, over the last 1 year, the fund has averaged a discount of 8.31%. That puts the 1-year z-score at an attractive -2.73. Over the longer term, we can see that the fund’s average discount has been fairly deep. However, the current level has a discount even below that level.
YCharts
Distribution – Monthly Pay
JRI currently has a distribution yield of 8.04%. On a NAV basis, it currently comes at a reasonable 7.06%. The lower NAV yield relative to the share price yield is another selling point for a fund trading at a deep discount. The difference between what the fund has to earn and what the fund is paying to shareholders can be pretty substantial. In this case, there is almost a solid 1% differential.
Over time, the fund has a long slow history of reducing its distribution. That is unfortunate but ties back to the fund’s longer-term performance. It wasn’t earning what it was paying out, so it made sense for them to adjust this.
JRI Distribution History (CEFConnect)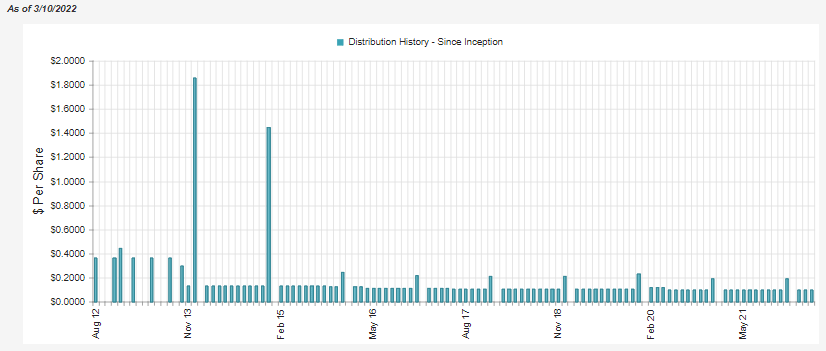
At the same time, it hasn’t been all hopeless for longer-term investors. The fund launched at a NAV of $19.06 in 2012. The fund’s current NAV is $16.53, but also, over this time, the fund has paid out a total cumulative amount of $16.8087 in distributions. This means that the fund has paid back a material amount to investors, working out to 88.2% of the original NAV. I think that helps demonstrate how important it is to factor in the distributions that closed-end funds pay.
In terms of coverage for the fund’s distribution, they have a meaningful coverage amount coming from net investment income. NII can be seen as more reliable due to the dividend and interest coming into a fund. This is positive to see for the fund. Since a meaningful portion is fixed-income or preferred, we want to see higher NII. However, NII can change between every reporting period with an actively managed portfolio.
Capital gains can be more based on what the broader markets are doing and the success of the managers to maneuver the fund. That makes them more unpredictable. Though with equity funds over time, they can also be a fairly reliable source for funding a distribution too.
JRI Annual Report (Nuveen)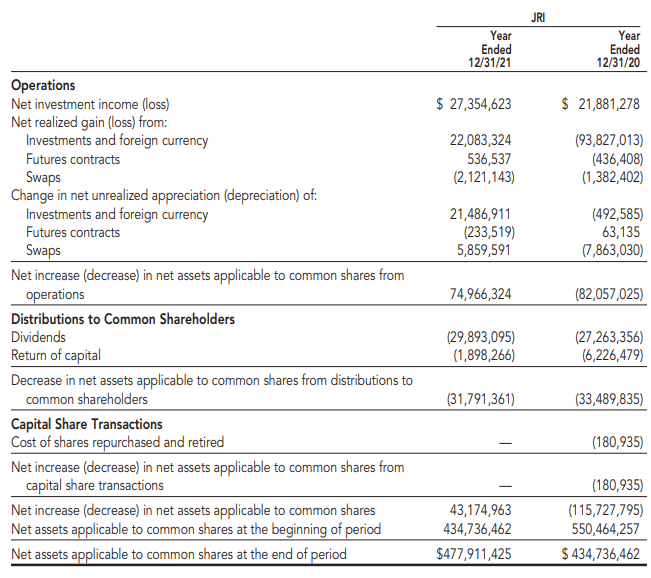
We can also see that NII for JRI has increased meaningfully from 2020 to 2021. That is another positive to see for the fund. NII coverage came in at 86% for 2021. A meaningful increase from last year’s 65.34% NII coverage. It was helped by the 25% increase in NII generation and by the decrease of 5% in total distributions to shareholders.
I’d argue that if 2022 was going better more broadly in terms of appreciation for the fund, we could have seen an increase based on the solid coverage. However, I’d be more conservative here and say that they should maintain the distribution at current levels.
For tax purposes, the bulk of JRI’s distribution over the last two years has been ordinary income, and return of capital has also been present.
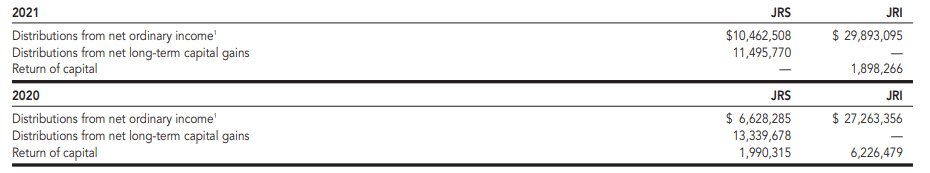
Taking a look at the more detailed breakdown provided for 2021, we can see that 36.58% was ordinary income, 43.69% qualified dividend income, 12.11% section 199A income, and then 7.62% return of capital. This seems to be one of those funds that wouldn’t be a bad idea if you can hold it in a tax-sheltered account. At the same time, there is a sizeable portion here classified as qualified dividends that can reduce an investor’s tax obligations in a taxable account.
JRI’s Portfolio
JRI is very active in its portfolio; the fund last reported a turnover of 73% for 2021. That was the lowest figure they have reported in the last 5 years. The last 5 years have averaged a portfolio turnover rate of 91.4%. That means they are doing a lot of buying and selling throughout the year. At the same time, the actual weightings in the portfolio in its asset allocations have remained relatively stable considering the turnover rate. Nuveen also does a better job of updating their positioning more frequently than other sponsors.
The latest reported breakdown was at the end of January. There we can see that real estate common stocks come in as the largest weighting, though infrastructure common is also a substantial size. Infrastructure preferred additionally has a material allocation for the fund.
JRI Asset Allocation (Nuveen)
From the end of October, when we last looked at the fund, we see that real estate common and infrastructure common have diverged closer. Real estate had fallen from its previous 30.2% weighting, while infrastructure jumped up from 23.9%. One of the reasons for this, I believe, would be that the infrastructure is tied to energy companies through pipeline exposure. At the same time, real estate has been a weaker performer for the year. I’m measuring this by the Real Estate Select Sector SPDR ETF (XLRE).
YTD Sector Performance (Seeking Alpha)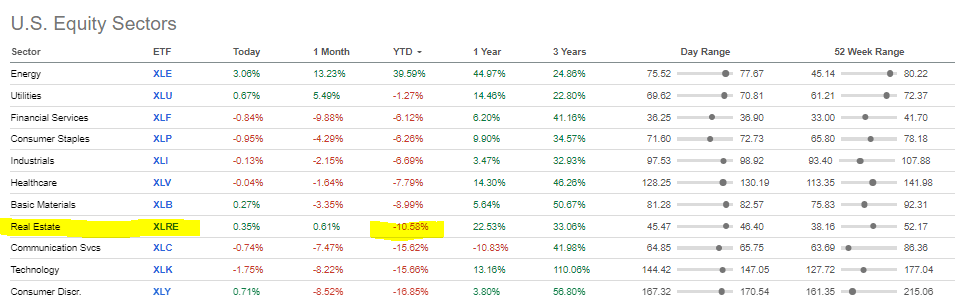
Therefore, some of these changes don’t seem to have been a conscious effort but simply a natural change in broader performances.
At the same time, the pipeline exposure has remained relatively flat since our previous update. The electric utility exposure has increased. That could indicate that they were taking some profits as the pipeline exposure in the fund had been performing well.
JRI Top Sector Allocation (Nuveen)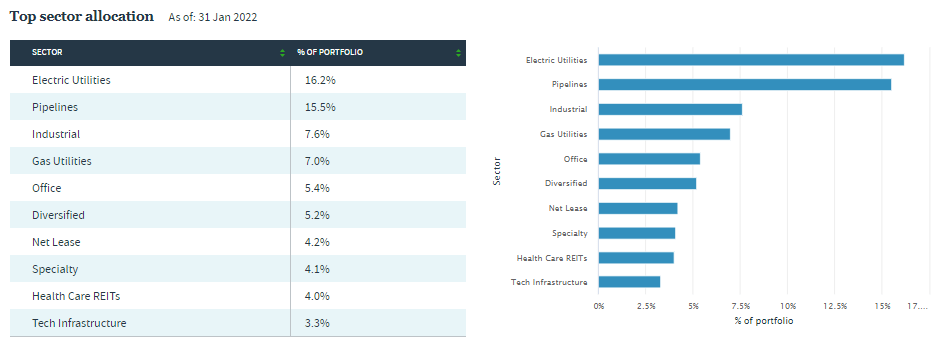
Taking a look at the top ten holdings will give us a better idea of how they might be positioning the fund or how it has changed since our last update.
JRI Top Ten (Nuveen)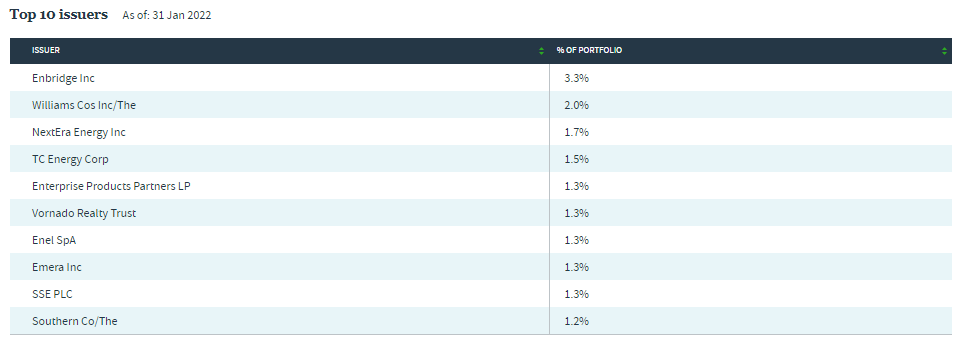
Overall, we see that the positioning hasn’t changed all that much in terms of names that are new or that have dropped off. Enbridge (ENB), Williams Companies (WMB), and NextEra Energy (NEE) still all represent the three largest positions. Enterprise Products Partners (EPD) has dropped down a position to make room for TC Energy (TRP). WMB, EPD, and ENB have performed well as pipeline infrastructure plays. NEE has been a bit disappointing as a utility play, but so has TRP even though it is a pipeline company.
YCharts
At the same time, Simon Property Group (SPG) has dropped out as one of the largest positions. Vornado Realty Trust (VNO) has held on to a top position as another REIT. That being said, VNO has underperformed SPG from the end of October to the end of January. Both of these REITs continue to operate in challenging fields of shopping centers for SPG and office space for VNO.
YCharts
The credit quality is fairly split between investment grade and junk-rated debt. This can further provide diversification for the fund. One of the downsides here is that the investment-grade debt will be more sensitive to interest rate changes. With interest rates expected to be increased by the Fed, that could lead to underperformance in that area. At the same time, it is safer debt, so that is the trade-off. With higher yield debt often has shorter maturities, meaning less interest-rate sensitivity. We also already touched on the fund’s duration being minimal at this time.
JRI Credit Quality (Nuveen)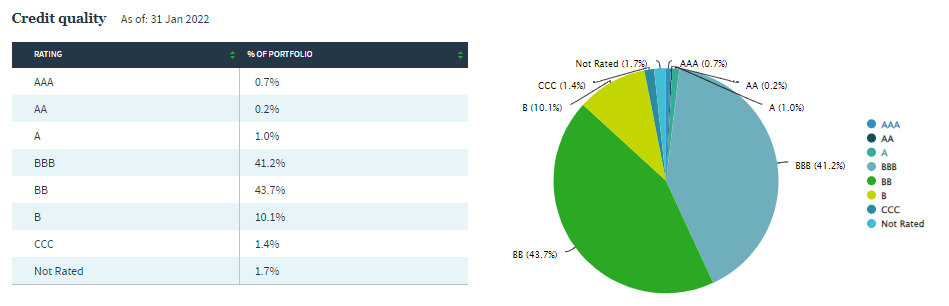
The other area that makes this fund more diverse than most CEFs trading today is the split of positions between market capitalizations. The fund carries 462 positions; those are spread across 59.02% in large-cap, 22.91% in mid-cap, and 18.07% in small-cap. The small-cap exposure is more unique in that most CEFs don’t provide exposure to that area of the market.
Conclusion
JRI has an interesting approach to the real asset space, investing through a multi-asset approach combined with even more diversification through credit quality and market caps. The limiting factor here is the focus on real assets, but even that can mean fairly strong diversification through utility companies, pipelines, and real estate. Real estate itself can provide exposure to a wide array of industries: office, retail, healthcare, and tech.
At the same time, JRI packages all of these various positions up and delivers regular monthly income to shareholders. Based on the deep discount, the fund presents an attractive entry price for investors who want this type of exposure.