Port congestion — which dramatically worsened in the second half of 2021 — appears to have temporarily peaked, although it’s too soon to tell whether it’s a reprieve before the next runup, a high-level plateau, or the beginning of the end.
The number of container ships waiting for berths at the ports of Los Angeles and Long Beach fell to 84 on Monday, the lowest tally since Nov. 2, 2021, and down 23% from the all-time high of 109 on Jan. 9.
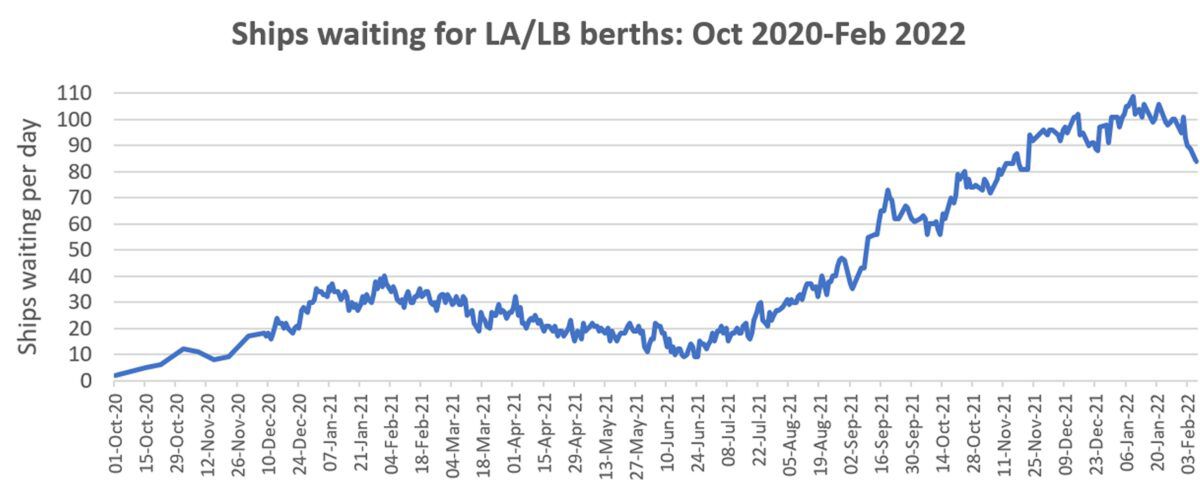
Whether due to seasonality or other factors, the recent pattern of ships waiting off Southern California has mirrored what happened the year before. The backlog grew throughout the fall, peaked around year-end, then began declining in the first few months of the year. In 2021, the queue numbers fell from February until the third week in June, then began climbing again.
Commenting on port congestion worldwide, John Coustas, CEO of container-ship owner Danaos (NYSE: DAC), told analysts on Tuesday: “We have seen a steady situation at the ports. It is not worsening but it is not getting better either. It has stabilized.”
Flexport Chief Economist Phil Levy told American Shipper: “I think there are some reasons to think things may be easing off. I think this one bears watching a little more closely.
“One reason is that when we had the big boom in bringing stuff in, it coincided with money being sent out by the government and real disposable income going up. We don’t see anything like that on the horizon, and instead you’ve got real disposable income sagging.”
Levy continued, “We always knew there were two ways this could ease off: the overall amount of money people had to spend could go down, or, of whatever they had to spend, less would be devoted to goods and more to services. And the share of goods in personal consumption expenditures has also started to go down a bit. We might be getting both at the moment.”
Other congestion indicators
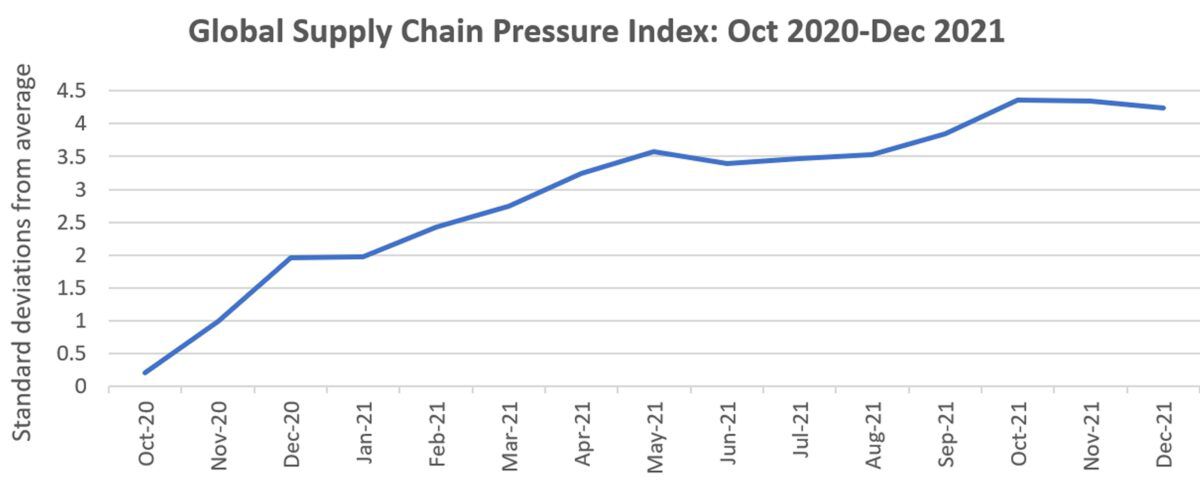
The New York Federal Reserve recently launched a monthly indicator called the Global Supply Chain Pressure Index (GSCPI), aggregating 27 different variables.
On Jan. 28, GSCPI numbers were retroactively tweaked through November and the December index number was released.
The GSCPI now shows a peak in October at 4.37 standard deviations above the average level of global congestion, followed by small declines over the next two months, bringing the GSCPI to a still extremely high 4.246 standard deviations above average. While the GSCPI has gone down, its pullback is much less significant than the decline in the West Coast queue.
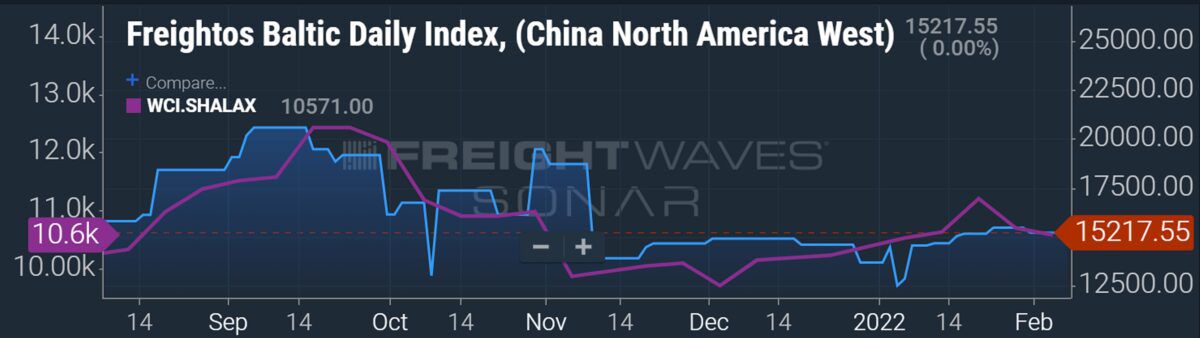
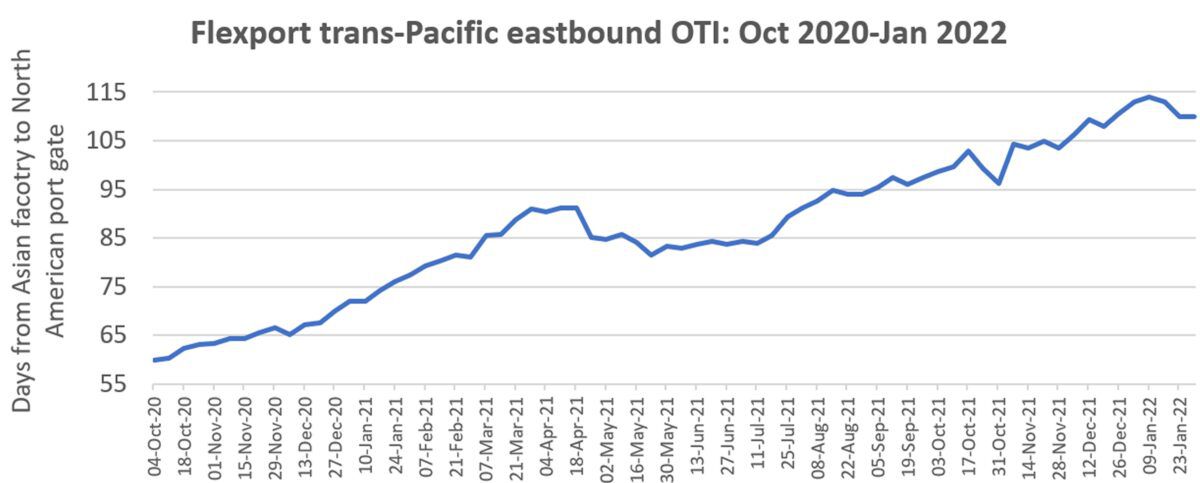
Another congestion indicator is published weekly by Flexport: the Ocean Timeliness Index (OTI). There have been some small pullbacks from the recent all-time high in the trans-Pacific eastbound OTI, but not enough to confirm a downward trend in congestion. As with the GSCPI, the OTI shows far less of a recent reversal than the West Coast ship queue.
During the week ending Sunday, the OTI indicated that it took an average of 110 days for cargo to get from a factory in Asia to the exit gate of a North American port, the same time it took in late December. The latest transit-time average is down from the record of 114 days in the second week of January, yet still up 42% year on year.
According to Levy, “One thing you have to remember is that there is a backlog, so if you do get a demand letup, it will take a while to clear things. We’re still way away from normal.
“So, the question is: Can this all be cleared by the time we head towards next peak season? And is this problem going to go away without any offsetting problems on the supply side, like the West Coast port [labor] negotiations.
“For you to sound the definitive all-clear, you need a decrease in demand, you need no problems on the supply side, and you need a period where you can clear everything out before we hit peak season. That’s a bunch of things that all have to go the right way.”
Click for more articles by Greg Miller
Related articles: