
NicoElNino/iStock via Getty Images
Written by Nick Ackerman, co-produced by Stanford Chemist
BlackRock Floating Rate Income Strategies (FRA) has been making some strong moves lately. Over the last month alone, the fund’s discount had gone from 5.42% to just 1.11%. A considerable decline from the 10% discount it was flirting with a year ago. It seems that all investors have received the same memo this time; higher rates will be coming in 2022.
That puts senior loans and funds that invest in senior loans in a particularly strong situation. They can benefit from the higher rates as a way to get more yield once they break through the rate “floor.” Stanford Chemist went more in-depth on the floor subject previously.
At the same time, the sister fund, BlackRock Floating Rate Income Trust (BGT), is trading a bit richer than FRA even. BGT was last trading at a 3.76% premium but had on a couple of occasions breached the 5% mark recently. While it too, was flirting with a 10% discount just a year ago. That really shows how much capital has been being pushed into these types of names.
Still, FRA remains a fairly compelling option to benefit from higher rates despite its less attractive discount. The attractive distribution yield it currently carries also makes it an attractive option.

FRA
BlackRock
The Basics
- 1-Year Z-score: 1.93
- Discount: 1.11%
- Distribution Yield: 5.8%
- Expense Ratio: 1.13%
- Leverage: 31.35%
- Managed Assets: $723.6 million
- Structure: Perpetual
FRA’s investment objective is “to provide shareholders with high current income and such preservation of capital as is consistent with investments in a diversified, leveraged portfolio consisting of floating-rate debt securities and instruments.”
To achieve this investment objective, “at least 80% of its assets in floating rate debt securities, including floating or variable rate debt securities that pay interest at rates that adjust whenever a specified interest rate changes and/or which reset on predetermined dates.” As is typical with these sorts of funds – the portfolio “invests a substantial portion of its investments in floating rate debt securities consisting of secured or unsecured senior floating rate loans that are rated below investment grade.”
The weighting towards below-investment-grade will be a function of the type of investments they are making. Junk-rated companies dominate the senior loan fund space. They wouldn’t be issuing floating-rate debt if they could help it. That means it can be more sensitive to economic conditions.
The fund is a fair size, but high leverage helps with that considerably. Net assets are just below $500 million while they are borrowing $223 million. 31.35% leverage ratio is something to watch but not uncommon in this type of fund. Senior loan funds often have higher leverage amounts.
The leverage from the fund is from a credit facility with floating rates. That means higher rates’ positive effects will be negated through higher interest rate costs to a degree. The fund’s expense ratio comes to 1.13% but climbs to 1.54% if including the leverage expense.
At the end of their six-month report period ending June 30th, 2021, the interest rate came to 0.95%. Quite low but will increase with rates. For some context, at the end of August 31st, 2018, FRA’s weighted average interest rate was 2.4% on borrowings of $238 million.
Performance – Reasonable Results
This is generally what I say about most senior loan funds. As I would reiterate, senior loan funds indeed weren’t a very attractive place to stay invested in the last decade+ now. With rates being so low, their returns have been relatively lower compared to other asset classes. If you are expecting S&P 500 returns, this is definitely the wrong place to be investing.

FRA Annualized Returns
BlackRock
Instead, I think it is more appropriate to compare the fund to other senior loan funds. Such as its sister fund, BGT; we will also include Blackstone Strategic Credit Fund (BGB) and Invesco Senior Income Trust (VVR). These two, in particular, just because I hold them in my own portfolio as my senior loan play. BGT makes sense to include to try to determine why it is trading at a richer valuation.
Below are the last 5-year total return figures. We can see that on a total NAV return basis, FRA comes in at the bottom and BGB on top. Overall, the returns are quite similar considering this is over the course of 5 years.

YCharts
We can also take a look at the 10-year returns. In this case, we have BGB carrying the bottom but FRA not too far behind. This could explain some of the valuation differences between FRA and BGT.

YCharts
Over both of these time frames, BGT had outperformed its sister fund. In the grand scheme of things, though, it hadn’t been to a meaningful degree in terms of total NAV return. Instead, it was mainly through total share price return. That reinforces why one might want to switch from BGT and FRA.
However, they are both still richly valued compared to their historical ranges. That puts them in a challenging situation where they can benefit from higher rates, but rich valuations mean some of the positives could be negated.

YCharts
Distribution – Frequent Adjustments
Another area that income investors concentrate on a lot is the consistency in distributions. For FRA, they have been adjusted a considerable number of times over the years relative to other CEFs. This seems to come with the territory as senior loan funds always have to adapt to interest rate levels. Rates have been on a decline for decades now, which has put pressure on all senior loan fund distributions.
That being said, the 5.8% distribution yield is quite attractive at the current level. The NAV rate comes to 5.74%.
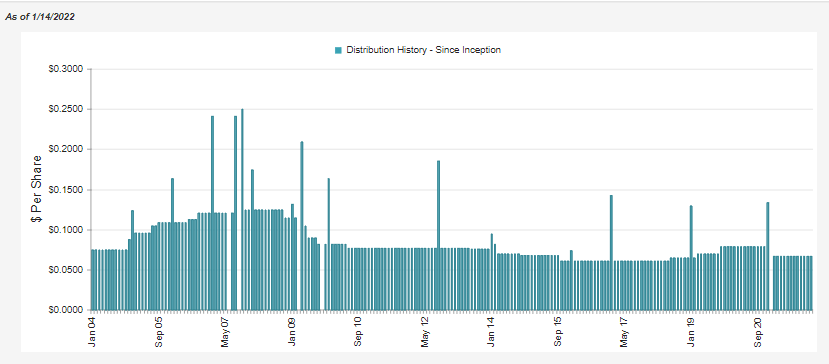
FRA Distribution History
CEFConnect
Distribution coverage will primarily come from net investment income. This is typical with most fixed-income funds, so nothing special here.

FRA Semi-Annual Report
NII coverage jumped to 99% with the latest earnings data from their Semi-Annual Report. That being said, at the end of November 30th, 2021, we received an update on the 3-month earnings coverage. It showed that coverage had slumped back down to around 81%.
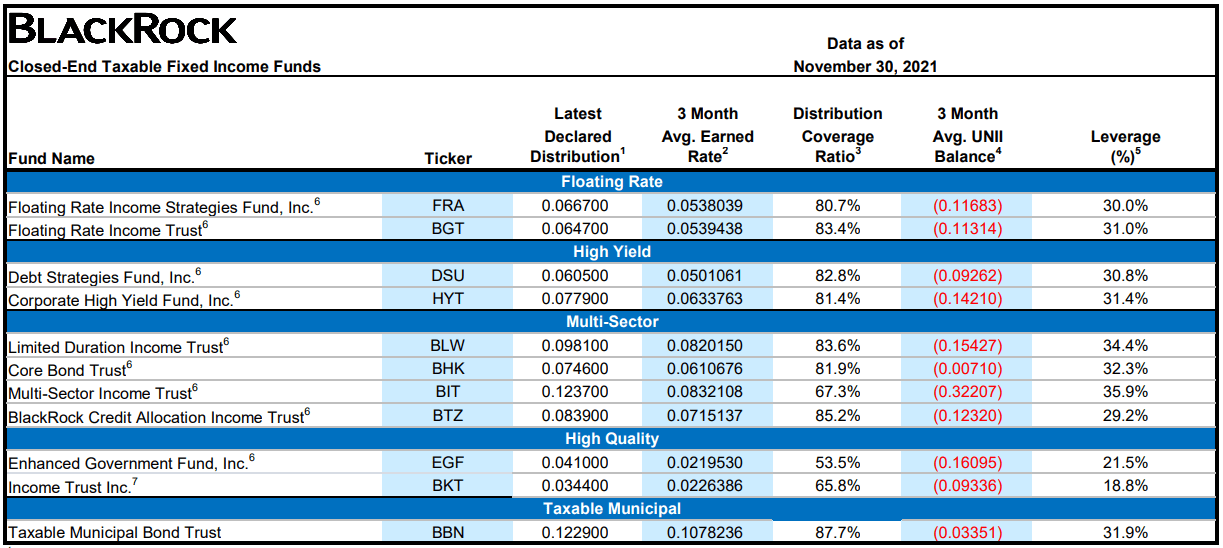
Earnings Summary
This will be something to monitor continually. 3-month coverage, in my opinion, is less important than 6 months, or even better 1-year coverage levels. We should see an updated report from FRA in a month or so to get a better idea of coverage. At least for now, they seem content on keeping the distribution rate the same, despite the lack of coverage. However, they announce distributions every month, so a change can happen anytime.
FRA’s Portfolio
As mentioned previously, the fund is dominated by senior loan investments; in this case, BlackRock calls them “term loans.” Due to these floating rate investments, the effective duration of FRA comes to just 0.32 years.
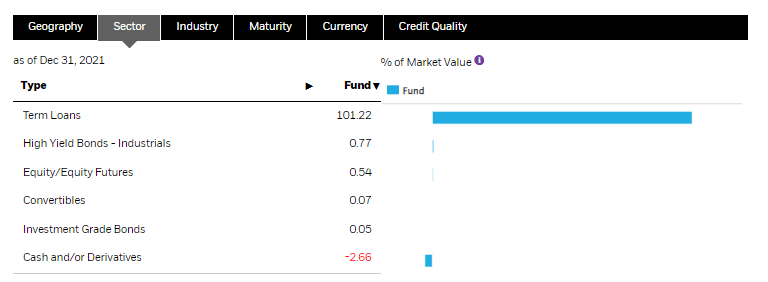
FRA Sector Allocation
BlackRock
Where we start to see diversification is the fund’s industry allocations. Tech positions make up the majority of the fund. That being said, it’s relatively diversified with a meaningful allocation in various industries outside of tech as well.
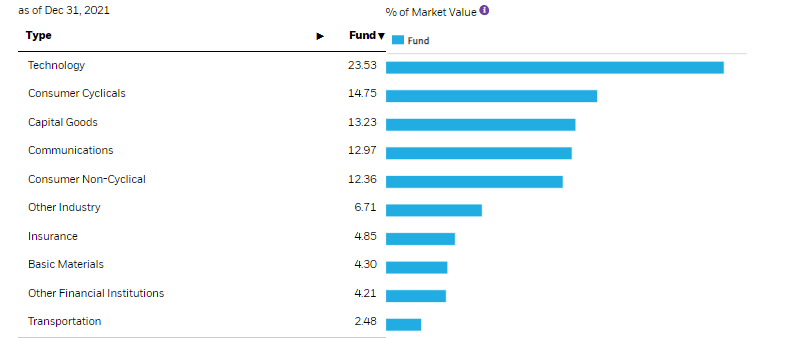
FRA Industry Allocation
BlackRock
From there, we can take a look at FRA’s credit quality breakdown. As warned above, the fund is invested in primarily junk-rated companies as that comes with the territory of investing in senior loans. In this case, B-rated debt makes up the bulk of this fund.
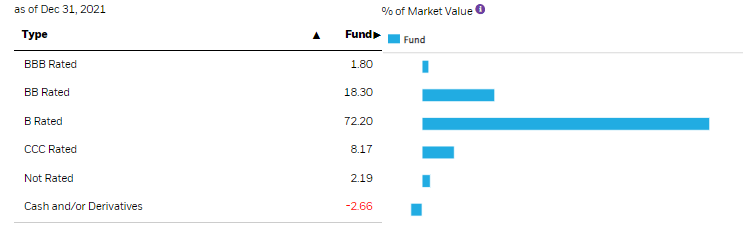
FRA Credit Quality
BlackRock
For some investors, that will be enough to scare them away. Admittedly, it does require a strong economy for these types of investments to continue to deliver their loan payments.
However, besides the industry diversification, we touched on above – FRA also carries 456 different holdings. That dramatically increases the chances that one position won’t carry too much of a drag on the portfolio.
The fund’s top ten allocations reinforce this. The top ten in FRA make up 12.03%. That’s a reasonably thin slice relative to some of the other funds we cover.
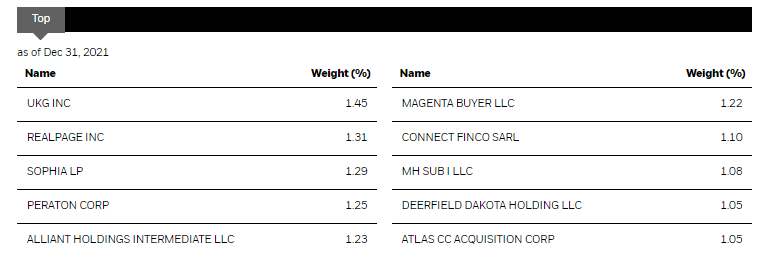
FRA Top Ten holdings
BlackRock
Conclusion
FRA has become a bit richer lately but is still a better deal than its BGT sister fund. This could be providing a fairly attractive time to switch from BGT to FRA. However, both funds are richly valued compared to their own historical range. BGT has outperformed FRA over time, but it was primarily in the form of total share price returns. The total NAV returns had been quite similar otherwise.
Senior loans and the funds that invest in them will be relatively more sheltered from increased interest rates. The real question then becomes how high-interest rates go and how long they might stay there.
I concede I have no answer to those two critical questions. It’ll depend on a multitude of factors beyond any single person’s control. That’s why I invest in a primarily diversified portfolio. In my opinion, though, adding some exposure to something such as senior loans isn’t a bad idea—a way to hedge just a bit or take advantage of the current market expectations.