
DKosig/E+ via Getty Images
Author’s note: This analysis was released to CEF/ETF Income Laboratory members on February 2, 2022. Please check latest data before investing.
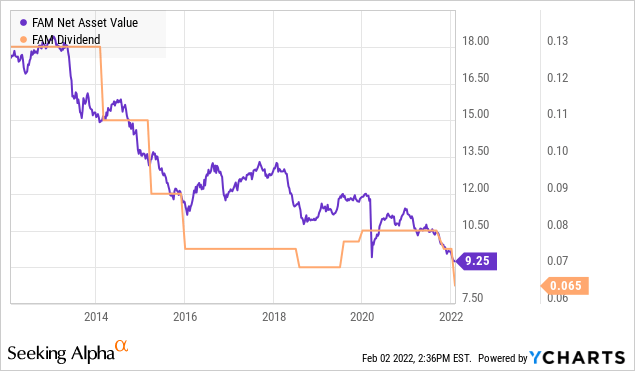
First Trust/Aberdeen Global Opportunity Income Fund (FAM) is a global fixed income CEF that gets brought up in the Income Lab chat from time to time. In January, it announced a decrease in its monthly distribution from $0.075 to $0.065/month (-13.33%). The fund currently yields 8.69% (as of February 11, 2022).
First Trust/Aberdeen Global Opportunity Income Fund Decreases its Monthly Common Share Distribution to $0.065 Per Share for February
January 20, 2022 04:15 PM Eastern Standard Time
WHEATON, Ill.–(BUSINESS WIRE)–First Trust/Aberdeen Global Opportunity Income Fund (the “Fund”) (NYSE: FAM) has decreased its regularly scheduled monthly common share distribution to $0.065 per share from $0.075 per share. The distribution will be payable on February 15, 2022, to shareholders of record as of February 2, 2022. The ex-dividend date is expected to be February 1, 2022.
(Source)
In my view, the outlook for FAM is still negative. Even at the lowered rate of distribution, the payout is only 61% covered from earnings (up from 53% at the previous distribution level). For a regular fixed income fund, this isn’t what you want to see. Hence, investors need to realize that the fund’s 8.39% market yield will include a significant return of capital (“ROC”) component. Consistent overdistribution from earnings has led to an eroding of the asset base over time, and the dividend along with it.
Of course, ROC in itself is neither good nor evil. Total return calculations include all distributions paid, no matter their source. Unfortunately, total returns of FAM have been quite anemic, with an average return of +2.03% per year over 5 years and +1.82% per year over 10 years.
Part of this is due to the relative high baseline expense ratio of 2.00% that is charged by the fund. The expense ratio is even higher than the coupon of some of the bonds listed in the portfolio, meaning that the fund is taking more in management fees than the interest out of some of these bonds!
First Trust
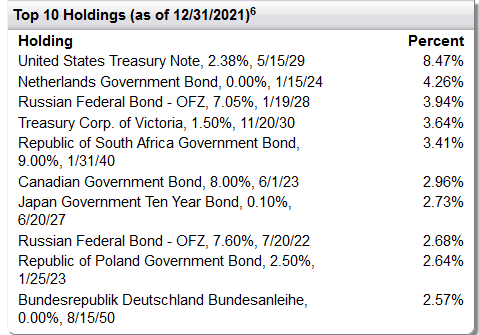
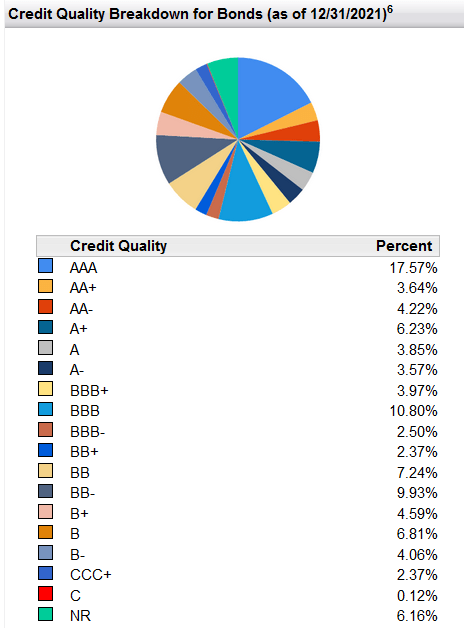
This is why I generally don’t recommend CEFs for funds that invest in investment grade paper (FAM is >56% investment grade) unless there has been a history of outperformance shown by the managers. Simply because at such low starting yields, the fees for active management will eat up a significant fraction of that income. Case in point: why does FAM own Japan government bonds yielding 0.1%? I can understand why the portfolio managers might do this if they’re bearish on Japanese interest rates or if they consider this to be a “safe haven” hedge, but it’s not giving out much in income, that’s for sure.
YCharts
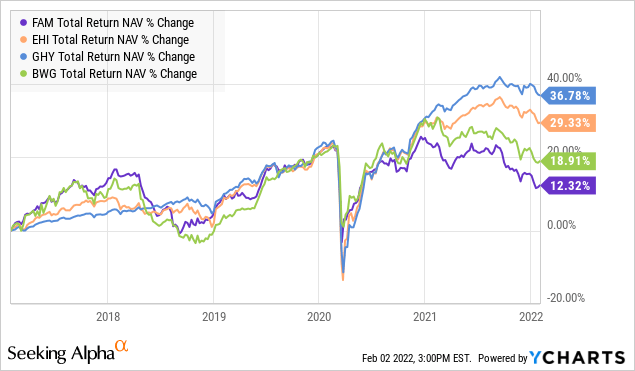
Instead, for those looking for global fixed income exposure, I’d instead suggest taking a look at Western Asset Global High Income Fund (EHI), PGIM Global High Yield Fund (GHY) or Legg Mason BW Global Income Opportunities Fund (BWG). These have larger US allocations than FAM so provide less international diversification, but have much better historical performance than FAM. Now, of course it must be stressed that they’re not peers because EHI and GHY have their majority of their portfolio in high-yield (aka “junk”) bonds, so are riskier in a downturn. BWG has a more similar credit profile to FAM with >55% investment grade bonds, but has a greater allocation towards corporate bonds compared to FAM which is mostly in government bonds.
The following chart shows the NAV performance of these four funds over the past 5 years. As we might have expected, the two high-yield funds (EHI and GHY) have fared better in a bull market environment. For the other two funds with majority investment grade exposure, BWG leads FAM.
YCharts
Valuation-wise, FAM is significantly more expensive than the other three funds.
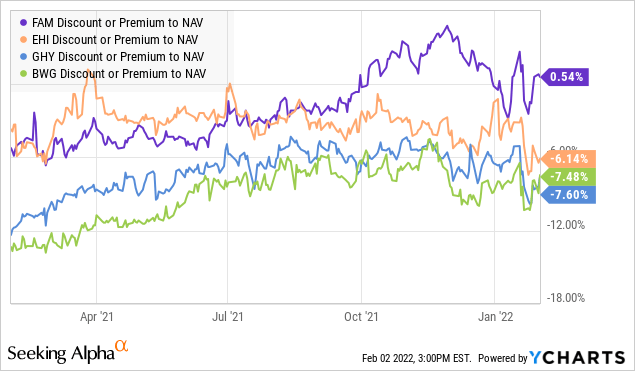
YCharts
FAM is also highly expensive relative to its own history.

CEFConnect
Taking all of the factors above into consideration, FAM isn’t an attractive investment opportunity at the present time in my opinion.