INTRODUCTION
In contrast to their crystalline counterparts, glasses lack any long-range order. In turn, for energetical reasons, glasses often exhibit a short-range order that is fairly similar to that of crystals (1). Hence, the distinctive out-of-equilibrium nature of the glassy state is largely associated with the uniqueness of glasses’ medium-range order. The existence of some level of order in the medium-range structure of oxide and chalcogenide glasses is often linked with the onset of a first sharp diffraction peak (FSDP) in their diffraction pattern—which denotes that some well-defined structural units associated with intermediate typical repetition distances can be found in the structure of glasses (2). In silicate glasses, the medium-range order structure is primarily encoded in the ring size statistics—wherein a ring is defined as a closed-path in the atomic network of glasses. Although the ring statistics play a key role in governing glass properties (3), this structural feature is largely invisible to conventional experimental techniques and, hence, remains mostly unknown.
As an alternative route to experiments, atomistic simulations can infer the structure of a glass based on some available information (e.g., the interatomic forcefields) and, hence, provide direct access to the ring statistics in simulated glasses (4, 5). However, these modeling techniques are affected by their own limitations (6). On the one hand, molecular dynamics (MD) simulations leverage the knowledge of interatomic forcefields to form glasses by “melt-quench” but are plagued by the need to use high cooling rates. This raises questions about their ability to offer a realistic description of glasses’ medium-range order—especially since the ring statistics strongly depends on the cooling rate (7). On the other hand, reverse Monte Carlo (RMC) simulations are used to invert available experimental data into a three-dimensional structure, but RMC-based structures are often thermodynamically unstable (8). More generally, constructing realistic atomic structures for glasses that match available experimental signatures (e.g., diffraction patterns) is intrinsically an ill-defined problem since an infinite number of atomic structures can yield the same signatures. Hence, although it is straightforward to determine that a model glass structure is invalid (if it does not match with at least one experimental signature), it is virtually impossible to robustly demonstrate that a model glass structure is valid. All these aspects demonstrate the difficulties to reveal the true medium-range order structure of glasses.
To uncover glasses’ medium-range order, we developed a heuristic method (RingFSDP) that, based on experimental data, aims to extract the ring size distribution in a silicate glass from the shape of its neutron structure factor’s FSDP, FFSDP(Q) (9). In this method, the FSDP is deconvoluted into three Gaussian distributions with fixed peak position Q, wherein each distribution is ascribed to a certain family of rings: (i) large rings (≥6-membered) centered at low Q, (ii) medium rings (5-membered) centered at intermediate Q, and (iii) small rings (≤4-membered) centered at large Q. Note that the ring sizes are here expressed in terms of the number of network-forming atoms they are made of. The fraction of each of these three types of rings is then determined from the relative integrated area under each of these three Gaussian distributions. However, similar to any empirical methods developed from experimental data, the model-free RingFSDP approach relies on two core assumptions regarding how each type of ring contributes to the FSDP: (i) FFSDP(Q) is composed of three Gaussian distributions Fn(Q) that are associated with different groups of ring sizes, and (ii) the average position of these Gaussian distributions is fixed and does not depend on the glass composition (e.g., the identity of glass former species comprising the ring, namely, Al and Si in aluminosilicate glasses). In this contribution, we validate these two assumptions to offer a robust, sound foundation for the RingFSDP method.
Here, to establish our conclusions, we first uncover by simulation the valid structure of two representative silicate glasses by combining neutron diffraction experiments and force-enhanced atomic refinement (FEAR) (8, 10, 11). We then compute the ring size distribution from the FEAR-simulated structures and isolate the contribution of each ring size to the structure factor FSDP. On the basis of these results, we offer a robust support for the two core assumptions of the RingFSDP method. Eventually, we demonstrate that the ring size distribution in silicate glasses can indeed be experimentally determined on the basis of the deconvolution of their FSDP.
RESULTS
Uncovering glass structure by FEAR simulations
To establish our conclusions, we investigate the medium-range order of two representative silicate glasses, namely, glassy silica and an industrial alkaline-earth aluminosilicate glass named Jade (12). These two glasses are chosen so as to ensure that the method developed herein applies to the archetypical SiO2 glass, as well as a more complex modified silicate glass Jade—(CaO)6(MgO)7(Al2O3)13(SiO2)74—which comprises some network modifiers and two network-forming elements. The time-of-flight (TOF) neutron scattering measurements of these two glasses are performed at room temperature on the nanoscale-ordered materials diffractometer (NOMAD) at the Spallation Neutron Source (SNS), Oak Ridge National Laboratory (see Methods). This yields the neutron structure factor for each of these glasses.
To decode the linkages between ring size distribution and FSDP, we then use the measured neutron structure factors to uncover the atomic structure of these glasses by adopting the FEAR method (10). The FEAR modeling approach relies on an iterative combination of RMC refinement and energy minimization cycles. Hence, by leveraging all the available information (i.e., both the interatomic forcefield and experimental data), the FEAR approach yields glass structures that simultaneously exhibit excellent match with experimental signatures and high thermodynamic stability (8). FEAR has been shown to offer glass structures that correspond to slowly quenched glasses and yield an improved description of glasses’ medium-range order as compared to conventional MD melt-quench simulations (8).
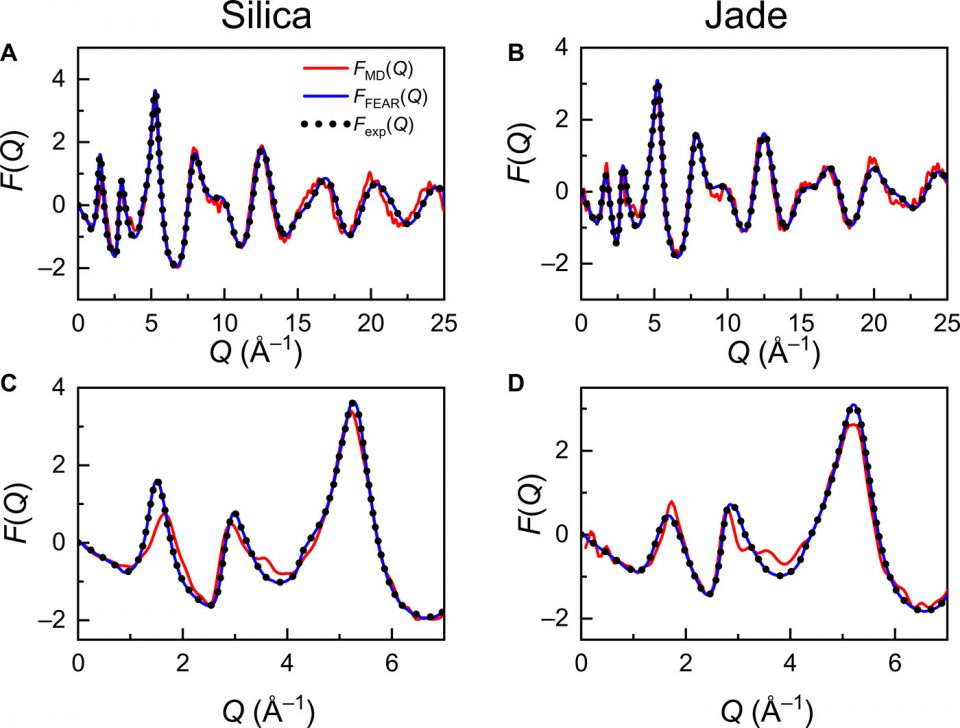
Here, we implement the FEAR approach following (8) to reveal the atomic structure of glassy silica and Jade—wherein the RMC cycles are conducted by using as constraint the neutron pair distribution functions (PDFs) measured herein (see Methods). For comparison, these two glasses are also simulated by conventional melt-quench MD simulations (see Methods). Fig. 1 shows the experimental and computed reduced structure factor F(Q) [where F(Q) = Q·(S(Q) − 1)], S(Q) being the structure factor] for the silica and Jade glasses. We observe that the FEAR-derived structure factors exhibit an excellent agreement with experimental data over the entire Q range—which is not unexpected since the neutron PDFs are used as input for the FEAR simulations. In contrast, the MD-derived structure factors present some notable discrepancies with experimental data. In detail, the level of agreement between MD and experimental data is satisfactory in the high-Q region (Q ≥ 4 Å) (see Fig. 1, A and B), which suggests that MD offers a decent prediction of the short-range order structure. However, the low-Q peaks are not well reproduced by MD (see Fig. 1, C and D), which indicates that MD fails at predicting a realistic medium-range order structure (especially for glassy silica). The realistic nature of the glassy structures generated by FEAR is further confirmed by their low energy (as compared to the structures obtained by MD), which denotes their thermodynamic stability (see Methods). The fact that FEAR offers an excellent description of the FSDP of the structure factor of both glasses (significantly improved as compared to MD) offers confidence in the ability of this simulation approach to yield a realistic description of the glasses’ medium-range order and, especially, of their ring size distributions.

[F(Q)] of (A and C) silica and (B and D) Jade glasses. The neutron experimental data are compared with simulation data obtained by FEAR and MD. In both cases, F(Q) derived by FEAR simulation (blue solid curves) matches well with neutron F(Q) (black dot curves), while significant discrepancy is observed for those of MD simulation (red solid curves), especially in low-Q region (Q < 4 Å−1) as shown in (C) and (D).
Contribution of individual ring sizes to the FSDP
Having established the realistic nature of the glassy structures generated by FEAR, we now use these model structures to decipher how each type of ring contributes to the FSDP. As a prerequisite to this analysis, we discuss the role played by the various definitions that have been proposed for “rings.” The very first ring definition—from King—was published in 1967 and defined a ring as the shortest path between two of the nearest neighbors of a given node; for silica, this refers to two oxygen atoms that are connected to a central silicon atom (13). The King’s definition was mostly used in the early studies revolving around ring size analysis (4, 14). In 1990, Guttman (15) proposed a different way of ring definition for silica materials by using the same shortest path concept. He first simplified the rings as being formed by Si atoms only. He then defined a ring as the shortest path that comes back to a given node (Si atom) starting from one of its nearest-neighbor Si atoms. Since Guttman’s criterion uses only one silicon nearest neighbor as the reference to search the shortest path ring, only the small-size rings (nmax ≤ 7 for silica glasses, wherein the ring size n is defined as the numbers of Si atoms in a ring) fulfill Guttman’s definition. The large rings (n > 8) that are identified by the King’s method are not counted as Guttman rings, as illustrated in (16). In that regard, Guttman’s rings can be considered as a subset of King’s rings, wherein both types of rings originated from the same “shortest path” definition. The third ring definition—primitive—was first introduced by Goetzke and Klein (17) in 1991 and then further developed by Yuan and Cormack (18) in 2002. Primitive rings adopt a different definition as rings that cannot be decomposed into two smaller rings. Another definition—strong ring—was extended from the primitive ring definition, wherein strong rings are not the sum of smaller rings. Therefore, strong rings are a subset of primitive rings, wherein both types of rings originated from the same “indecomposable ring” definition.
In the context of ring size analysis, the Rigorous Investigation of Networks Generated using Simulations (RINGS) code published in 2010 by Le Roux and Jund (16) has been widely used. To describe the connectivity of topological networks, RINGS provides five ways for ring counting, named as follows: (i) all-rings (no rules), (ii) Guttman’s, (iii) King’s, (iv) primitive, and (v) strong. Two definitions, all-rings and strong, are not adapted to enumerate rings in glassy structures. The all-rings definition enumerates all the rings without adopting any rules, which, in turn, results in an overcounting of the large-size rings (13). The strong ring is a technically valid definition but, in practice, does not apply to large disordered network. Since strong rings are a subset of primitive rings, searching for strong rings can be performed by finding the strong rings among the primitive rings. However, this strategy only applies to the simple crystal structure, whereas, in turn, the ring search tends to diverge for complex disordered structures [see (16)].
Therefore, only three definitions are eligible for ring size analyses in glass structures. Among RINGS’ users, the primitive definition has been almost exclusively adopted (19–21), with the exception of (22) wherein the Guttman’s definition was used. In most papers focusing on rings, no reasons are provided as to why a specific definition is adopted. Here, to uncover which one of these three definitions is relevant to describe the ring size distribution derived from the FSDP of scattering patterns, we compute the King’s, Guttman’s, and primitive ring size distributions for each FEAR-generated glass structure (silica and Jade). Results are plotted in Fig. 2. We find that the three definitions yield the same numbers of small-size rings (n ≤ 5), while we note the existence of differences starting from six-membered rings. Overall, the Guttman’s criterion yields the lowest total number of rings, and the identified rings feature a maximum ring size of 7. In contrast, the King’s criterion offers the largest total number of rings, including a large portion of large rings (up to n = 10). The total number of rings that are computed on the basis of the primitive definition lies in between those yielded by the Guttman’s and King’s criteria. These differences illustrate the critical role played by the definition that is used when computing rings.

(A) silica and (B) Jade glasses. Note that these three definitions yield the same number of small size rings (n ≤ 5), while divergences are observed starting from six-membered rings. The Guttman’s criterion (black) yields the lowest total number of rings and a maximum ring size of 7. The King’s criterion (red) yields the highest total number of rings. The total number of primitive rings (blue) lies in between the number of rings identified by the Guttman’s and King’s definitions.
In the following, we argue that the Guttman’s ring definition is the most relevant to describe the ring distribution derived from the FSDP of scattering patterns in terms of the probed length scale. The FSDP originates from medium-range order patterns within the glass structure that are associated with real-space typical repetition distances ranging from 3 to 4.5 Å. This range of distances matches with the typical diameter of the small-size rings (n ≤ 7) that are identified by Guttman’s criterion, whereas, in contrast, the large rings (n ≥ 8) that are identified by the King’s and primitive definitions are associated with larger diameters and, hence, would be only very weakly captured by the FSDP. In addition, as another important point, the Guttman definition yields a realistic total number of rings per network-forming atom, namely, 5.8 and 6.5 for the silica and Jade glasses, respectively. These numbers match with the value of 6 that is expected for fully polymerized glasses (13). In contrast, the King’s and primitive definitions yield two-to-three times more rings, which suggests that some of these rings are redundant. The method that is used herein to calculate the total number of rings per network-forming atom is described in the appendix B of (9). On the basis of these reasons, in the following, we systematically adopt the Guttman’s definition for this study, since it matches with the typical length scale that is probed by the FSDP and properly reflects the polymerization nature of the networks considered herein. However, note that this definition may not be appropriate for other types of structural characterization, for instance, to track the large-size primitive rings (n > 10) forming in the alkali-rich silicate glasses (18).
On the basis of the ring size distributions as shown in Fig. 3 (A and B), we investigate the contribution of each type of ring to the structure factor. This is achieved by isolating the selected family of ring, removing the other types of ring (as well as network modifiers) from the simulated structures, and lastly calculating the associated partial pair distributions. Using this approach, we compute the individual PDFs associated with fixed ring sizes n (with n =3- to 7 membered rings) and grouped PDFs associated with groups of rings [i.e., ≤4-, 5-, and ≥6-membered rings, which follows the group definitions used in the RingFSDP method (9)]. The computed reduced PDFs Gn(r) associated with individual and grouped rings are shown in Fig. 3 [C and D (individual), E and F (grouped)], respectively.

(A and B), reduced PDF Gn(r) of individual (C and D), and grouped (E and F) rings computed from the FEAR simulations. Note that the individual PDFs are associated with fixed ring sizes n (with n = 3 to 7), while grouped PDFs are associated with groups of rings (i.e., ≤4-, 5-, and ≥6-membered rings, as defined in the RingFSDP method). They are compared to the experimental neutron data (black dot curve).
We then compute the associated reduced structure factors Fn(Q) by Fourier transformation of the individual and grouped PDF Gn(r). Note that three- (for glassy silica) and seven-membered rings (for Jade) are excluded from this analysis as the low number of these rings (less than 20) does not allow for a statistically meaningful analysis. Figure 4 shows the computed individual reduced structure factors Fn(Q) associated with each ring size, along with the neutron diffraction data. Note that, at this point, we solely focus on the positions of the peaks, since the decomposition of the structure factor into contributions from different ring sizes renders the peaks’ intensity meaningless. We first note that, in the high-Q range (Q > 4 Å−1), the computed structure factors of both glasses present peaks that are all located at the same positions. This indicates that the different types of rings exhibit fairly similar short-range orders (namely, the structure of the SiO4 and AlO4 polytopes does not depend on the ring size), which echoes the fact that the peak positions in the low-r region (r < 3 Å) of the PDFs are unaffected by the ring size (see Fig. 3, C and D). However, we observe that the computed structure factors exhibit some notable differences in the low-Q region, at the vicinity of the FSDP (see Fig. 4, C and D). In both glasses, we find that the position of the FSDP in the individual structure factors systematically shifts toward higher-Q values upon decreasing ring size. This echoes the fact that smaller rings present lower diameter and, hence, are associated with lower typical repetition distances. These simulation results demonstrate that the ring size distribution is encoded in the position and shape of the FSDP so that, in turn, the deconvolution of the FSDP indeed offers a robust mean to uncover the ring size distribution of glasses based on their diffraction pattern (which is the basis of the RingFSDP method).

(A and C) silica and (B and D) Jade glasses computed from the FEAR-based glass structures. All four panels adopt the same color scheme for different n-membered rings with the legend shown in (C) and (D). In the whole-range panels of ”FS (A) and Jade (B), resemblances are shown for the same high-Q peaks (Q > 4 Å−1) from different sized rings, with their positions in the vicinity range of the corresponding neutron F(Q) peaks (black dot curve). (C) and (D) A zoom on the low-Q domain, in which the structure factors are vertically shifted with respect to each other to improve readability, and the red arrows aim to guide the eye so as to visualize the shift in the position of the FSDP.
Contribution of ring size groups to the FSDP
When deconvoluting experimentally measured FSDPs, simultaneously considering all the ring sizes presented in Fig. 3 (i.e., 3 to 7) would require a large number of fitting parameters, which would render the deconvolution impossible. The RingFSDP method was empirically developed from the analysis of 81 aluminosilicate glasses (9). Each FSDP was fitted in its real-space representation, by two-, three-, and four-Gaussian distributions with all parameters being refined (including peak position, width, and intensity). Two-Gaussian distributions only offer reasonable fittings for glasses containing low silica contents (which exhibit small sized-rings) but not for silica-rich glasses (especially glassy silica) that tend to contain larger populations of large-sized rings. Then, it is determined that three-Gaussian distributions, corresponding to three groups of rings, are the minimum number to fit all the 81 glasses with satisfactory agreement with neutron-measured FSDP. It is also found that the positions of three-Gaussian distributions always converge to constant values, i.e., 3.15 ± 0.01, 3.70 ± 0.03, and 4.30 ± 0.04 Å, respectively, where the mean and SD values are calculated from 81 glass fittings. Four-Gaussian distributions definitely improve the fitting quality for silica-rich glasses. For example, the low-Q side of FSDP from glassy silica (Fig. 5C) can be fitted much better by adding a forth Gaussian peak. However, the increased number of fitting parameters also leads to unreliable fitting.

The grouped Fn(Q)-FSDP contributions computed from FEAR-based glass structure match with Fn(Q) deconvoluted by RingFSDP method for (A and C) silica and (B and D) Jade glasses. For clarity, in (A) and (B), a linear background is subtracted from the computed structure factors to better isolate the FSDP peak. (C) and (D) The decomposition of the experimental FSDP following the RingFSDP approach.
Therefore, the RingFSDP method is based on the core concept that the contributions to the FSDP of these three groups of rings are located at different fixed-Q positions so that the deconvolution of the FSDP enables the quantification of the fraction of these three families of rings (9). Hence, in the following, we solely focus on the enumeration of grouped families of rings (i.e., ≤4-, 5-, and ≥6-membered rings, in line with the original RingFSDP method). To support this approach, we compute each structure factor of these three groups of rings from the FEAR model. Figure 5 (A and B) shows the FSDP in the computed three grouped structure factors, wherein, for clarity, a linear background is subtracted from the computed structure factors to better isolate the FSDP peak. Once again, we find that the FSDPs in these three grouped structure factors are located at notably distinct positions—wherein the FSDP associated with small (≤4) and large ring groups (≥6) are systematically located at larger and lower Q positions than for the intermediate (five-membered) rings, respectively. The positions of the FSDPs of the three grouped structure factors calculated from FEAR-based structures (Fig. 5, A and B) exhibit a very good agreement with the three fixed-Q values (Fig. 5, C and D) that were empirically derived from the FSDP deconvolution of 81 silicate glasses (9). These three Q values correspond to the real-space typical repetition distances that correspond to the typical effective diameter of small, intermediate, and large rings, respectively (9). This verifies our first assumption and strongly supports the core concept behind the RingFSDP method.
On the basis of the grouped structure factor computed from the FEAR-based glass structures, we find that the FSDPs associated with the three groups of rings exhibit a fairly similar peak location in the silica and Jade glasses (see Fig. 6). Intuitively, this seems unexpected since the rings found in glassy silica solely comprise Si─O bonds (1.62 Å), whereas, in contrast, Jade glasses also contain longer Al─O bonds (1.74 Å). Nevertheless, the analysis of the simulated structures reveals that the longer Al─O bonds are compensated by smaller Al─O─Si or Al─O─Al angles (5) so that, overall, the A-A distance (wherein A = Si or Al) remains fairly constant (around 3.1 Å). The constant A-A distance appears to be a generic feature of oxide phases with tetrahedral polytopes, including both crystalline and amorphous SiO2 and GeO2 (23), alkaline-earth aluminosilicate glasses (5, 24), and 39 tectosilicate crystalline materials with a wide range of Si/Al ratios and very different framework structures ranging from open-structured zeolites to densely packed coesite SiO2 (25). The generality of the constant A-A distance suggests that, in oxide glasses, the A-O-A angle tends to adapt its average value to achieve a constant A-A distance (rather than the A-A distance being determined by the A-O-A angle). This observation is important since it suggests that the perimeter (and effective diameter) of the rings is not notably affected by the type of network former they are made of. Hence, this supports the fact that the positions of the three Gaussian distributions used to deconvolute the FSDP are constant and do not significantly depend on the glass composition, which, in practice, is an important prerequisite to applying the RingFSDP method (9). This implies that the reliable deconvolution of the FSDP only involves six fitting parameters (i.e., the intensity and widths of the three Gaussian distributions) rather than nine (i.e., if three additional fitting parameters were to be needed for the positions).

The Fn(Q)-FSDP derived by FEAR simulation for silica (red) and Jade (blue) glasses from the same ring size group are shown in (A) ≤4-, (B) 5-, and (C) ≥6-membered rings. The similar peak positions are observed in all three panels as guided by straight black dashed line except a little difference for ≤4-membered ring groups, indicating that the ring size is independent of the former identities, which comprised the ring.
Revealing the ring size distribution in silicate glasses
Last, having established a robust foundation behind the RingFSDP method, we now apply this approach to deconvolute the FSDP in the experimental neutron structure factor so as to uncover the fractions of the three groups of rings in the silica and Jade glasses. The decomposition of the FSDP is illustrated in Fig. 5 (C and D). In the case of the Jade glass, we find that the combination of the three Gaussian distributions offers an excellent fit of the FSDP. Although a satisfactory fit is also obtained in the case of glassy silica, we nevertheless observe some fitting discrepancy in the low-Q range (around 1 Å−1) of the FSDP. The fitting could be improved by considering an additional group of very large rings (≥7-membered rings). However, as described in the previous section, adding a fourth Gaussian distribution would increase the number of fitting parameters and, hence, negatively affect the reliability of the deconvolution of the FSDP, so we stick to the above-mentioned three groups of rings. The fractions of each group of rings are then determined on the basis of the areas under these three fitted distributions (see Fig. 5, C and D). Overall, we find that glassy silica exhibits most of the large rings (≥6-membered), while, in contrast, Jade exhibits an excess of five-membered rings. The results obtained for Jade echo the ring size distribution that was reported for another fully compensated aluminosilicate glass (CaO)13.5(Al2O3)13.5(SiO2)73 (9). These observations match with the outcomes of the direct enumeration of the rings based on the analysis of the glass structures simulated by FEAR (see Fig. 7). We also note that, in the case of glassy silica, the ring size distribution obtained herein matches with previous MD simulation results from Vashishta et al. (4) (see Fig. 7). We compare our results with Vashishta’s because the S(Q) calculated from their MD simulation matches well with the measured pattern obtained by neutron diffraction, especially in the FSDP region [as shown in figure 1 of (4)]. This indicates that their MD simulation yields a more realistic medium-range order structure than that predicted by the Beest-Kramer-Santen (BKS) forcefield used herein (see Fig. 1C). This improved level of agreement is likely on account of the fact that, unlike the present BKS forcefield, the Vashishta forcefield is a complex potential that features three-body energy terms.

(A) silica and (B) Jade glasses. The good match between experiment and modeling validates the RingFSDP method.
DISCUSSION
Although the RingFSDP method is necessarily incomplete since it is limited to small ring sizes (n ≤ 7), many studies (detailed in the following) have highlighted the unique and critical role played by small-size rings in glasses. Hence, quantifying the number of small rings is the key to decipher the nature of composition-structure-properties correlation in glasses and accelerate the development of new glass compositions with tailored functionalities. Specifically, our previous in situ neutron scattering study on fused silica (FS) revealed that the intensity of the FSDP associated with small-size rings (n ≤ 4) decreases more than those associated with large-sized rings upon increasing temperature (26). This denotes that small rings are fairly unstable, which echoes several recent observations: (i) Small-size rings (n = 3 and 4) are energetically unfavorable since they present much higher relative energies as compared to that of six-membered rings in FS (4); (ii) small size rings (n < 6) in sodium silicate glass (0.3Na2O·0.7SiO2) exhibit some significant internal stress on account of their overconstrained topological nature, whereas large-sized rings (n ≥ 6) do not (27); (iii) MD simulations echo our experimental in situ observations, namely, when alkaline or alkaline-earth silicate glasses are heated above their respective glass transition temperature, small-sized rings (n ≤ 4) show more marked change as compared to their larger counterparts (n ≥ 5) (21).
Together, the overall harmony between the experimental (i.e., obtained from the deconvolution of the FSDP) and simulated results (i.e., obtained from a direct enumeration of the rings) that are reported herein strongly supports the soundness of the RingFSDP approach. This is significant as, to the best of our knowledge, this approach is the only method enabling a direct estimation of the ring size distribution in silicate glasses while solely relying on experimental diffraction data.
METHODS
Neutron total scattering measurement
TOF neutron scattering measurements of two glasses were performed on the NOMAD at the SNS, Oak Ridge National Laboratory (28). Relevant experimental details are reported in (9). All the structure factors used in this study were normalized to the absolute correct scale using the low-r of G(r) criterion as described in (29).
Simulated systems
All simulations are carried out using the Large-scale Atomic/Molecular Massively Parallel Simulator package (30).
Silica. Glassy silica (SiO2) is an archetypical model glass. The simulated system comprises 3000 atoms. For this system, we adopt the BKS forcefield (31), which has been extensively used to investigate the structure, dynamics, and thermodynamics of silica (32–34). In line with previous studies, we use a cutoff of 5.5 and 10.0 Å for the short-range and long-range Coulombic interactions, respectively (32, 35). The long-range Coulombic interactions are calculated with the Particle-Particle Particle-Mesh (PPPM) algorithm (36) with an accuracy of 10−5.
Jade. Jade is an industrial alkaline-earth aluminosilicate glass used in display applications (12). The simulated system has the composition (CaO)6(MgO)7(Al2O3)13(SiO2)74 and comprises 3485 atoms. For this system, we adopt the interatomic forcefield developed by Guillot and Sator (37), which offers a great transferability over silicate systems (38–40). In line with previous studies, we use a cutoff of 11 Å for both the short-range and Coulombic interactions. The long-range Coulombic interactions are calculated with the PPPM algorithm (36) with an accuracy of 10−5.
Melt-quench simulations by MD
These two glasses are first simulated by MD simulations using the conventional melt-quench method (41), as described in the following. Initial disordered configurations are first created by randomly placing the atoms in a cubic box while ensuring the absence of any unrealistic overlap (42). The systems are then melted at 5000 K under zero pressure in the isothermal-isobaric [Number of particles, pressure, temperature (NPT)] ensemble for 100 ps to ensure the complete loss of the memory of the initial configuration (42). The systems are then linearly cooled down to 300 K under zero pressure in the NPT ensemble with a cooling rate of 1 K/ps (42). For all simulations, we adopt the Nosé-Hoover thermostat and a fixed time step of 1 fs (43).
Computation of the neutron PDF
To compare the simulated structure with neutron diffraction data (and as a prerequisite for the FEAR simulations), we compute the neutron PDF gN(r) of the simulated structures by combining the partial PDFs gij(r) as(1)where ci are the molar fractions of element i (i = Si, Al, Ca, Mg, or O), bi are the neutron scattering lengths of the species (44), and r is the real-space distance. Note that, to enable a meaningful comparison between simulated and experimental PDFs, the simulated PDFs need to be broadened (45). Here, this is achieved by convoluting the computed PDFs with a normalized Gaussian distribution with a full width at half-maximum (FWHM) given by FWHM = 5.16/Qmax (41), where Qmax is the maximum wave vector used in the diffraction test (here, Qmax = 50 Å−1). The level of agreement between the simulated and experimental PDFs is then captured by the Rχ factor proposed by Wright (45)(2)
The Rχ factor is here calculated from r = 0 to10 Å.
RMC simulations
The experimental neutron pair distribution can be inverted into a three-dimensional atomic structure by conducting an RMC simulation (46, 47). This method iteratively refines the position of the atoms in a simulation box until the glass exhibits a structure that matches available experimental data (e.g., the neutron PDF). In detail, the RMC method consists of the following steps. (i) Starting from a “random” initial configuration, the PDF of the simulated structure is computed, and the Wright’s coefficient is calculated (see Eq. 2) (42). (ii) An atom is randomly selected and displaced with a random direction and distance (42). (iii) The PDF of the new configuration and the new cost function are computed (42). (iv) Following the Metropolis algorithm, the new configuration is accepted if , that is, if the level of agreement between simulated and experimental structure is enhanced by the Monte Carlo move (42). Otherwise, the atomic displacement is accepted with the following probability or refused otherwise(3)where Tχ plays the role of an “effective temperature” that controls the probability of acceptance (that is, higher values of Tχ result in higher probability of acceptance of the Monte Carlo moves) (42).
FEAR simulations
Because of their high computational cost, MD simulations are limited to high cooling rates (e.g., 1 K/ps here), so that glasses generated by MD are typically more disordered (i.e., associated with higher fictive temperature) than their experimental counterparts (41). To address this concern, we adopt the FEAR method introduced by Drabold et al. (10). In contrast to MD simulations (which use the knowledge of the interatomic potential) and RMC simulations (which use the knowledge of experimental data), the FEAR approach leverages all the available information.
In detail, this method relies on an iterative combination of RMC refinements and energy minimizations. We first start from a “randomized” structure generated by RMC while using a large fictive temperature, namely, Tχ = 5000 (42). The system is then iteratively subjected to a combination of RMC refinement and energy minimizations, wherein each FEAR iteration consists of (i) 3000 RMC steps and (ii) an energy minimization conducted with the conjugate gradient method under fixed volume (42). RMC refinement steps are conducted using the experimental neutron PDF as constraint. To ensure meaningful comparison, similar simulation parameters (e.g., system size, interatomic forcefield, cutoff, etc.) are used for the MD and FEAR simulations. We find that 20 and 50 of these iterations are sufficient to achieve a convergence of energy and Rχ for silica and Jade, respectively (see Fig. 8). During the refinement, we dynamically adjust the average acceptance probability of the Metropolis algorithm by linearly decreasing the effective temperature Tχ from 103 down to 10−4. This procedure was found to yield glass structures simultaneously exhibiting minimum values of Rχ and potential energy.

Rχ (A and B) and molar potential energy (C and D) by FEAR and MD simulation. Results are presented for the (A and C) silica and (B and D) Jade glasses. These data are compared with those obtained by MD simulations (shown as horizontal dashed lines) using the melt-quench approach (using a cooling rate of 1 K/ps).
FEAR versus MD comparison
We now compare the Rχ and potential energy values offered by FEAR refinement with those of MD simulations (42). As shown in Fig. 8 (A and B), we first note that, upon FEAR refinement, the Rχ factor of the simulated glasses monotonically decreases and eventually reaches a final Rχ factor of 5.19 and 8.5%, respectively. This denotes that the simulated structures exhibit an excellent agreement with experimental data (since Rχ < 10% is typically considered as an acceptable level of agreement). In contrast, we note that the MD simulations relying on melt-quenching yields a significantly higher Rχ value (larger than 15%). This shows that FEAR yields some glass structures that exhibit a notably increased level of agreement with experimental diffraction data, which is not unexpected since the neutron PDF is used as input during the FEAR refinement.
We then focus on the thermodynamical stability of the configurations generated by FEAR and MD. We observe that FEAR yields a potential energy that is significantly lower than that offered by MD (see Fig. 8, C and D), which echoes previous findings (8). This is important since it implies that, although FEAR and MD rely on the same interatomic forcefield, adding a structural constraint (i.e., the neutron PDF) allows the structure to reach lower energy states. This indicates that the RMC refinement steps allow the system to jump over some large energy barriers that cannot be overcome during the fast-cooling phase in MD simulations so that the FEAR-generated glass structures can eventually occupy deeper positions within the energy landscape, which would otherwise require small cooling rates to be spontaneously reached. Overall, these results demonstrate that FEAR refinement can generate some glass structures that simultaneously exhibit an unprecedented level of agreement with experimental data and energetical stability (42). This offers confidence in the fact that the FEAR-generated structures can be reliably used to decipher how the ring size distribution is encoded in the FSDP of their structure factor.
Role of the interatomic potential
To assess whether or not the outcome of the FEAR method depends on the choice of the interatomic potential used during the energy minimizations, we repeat the FEAR simulations while using selected alternative forcefields. Specifically, we adopt the new interatomic potentials listed in the following: (i) for glassy silica: the potentials from Guillot et al. (38) and Pedone et al. (48); (ii) for Jade: the potentials from Teter (49) and Pedone et al. We select these potentials as, although they all present a two-body formulation, they rely on different analytical forms, different parameterizations, and different partial charges. Note that, for consistency, all the other simulation parameters are kept constant. Figure 9 (A to D) shows the neutron structure factor and ring size distribution predicted by FEAR while using these potentials. Overall, we find that all these potentials yield virtually the same neutron structure factor and the same ring size distribution—both for glassy silica and Jade. The fact that the outcomes of the FEAR simulation do not notably depend on the choice of the interatomic potential contrasts with the case of MD simulations, which heavily depend on the interatomic forcefield. This can be understood from the fact that, in FEAR, the structure is mostly determined by the RMC steps. Rather, here, the energy minimizations solely ensure that the structure never deviates too much from an energetically stable state upon RMC refinement but, in turn, do not notably affect the final structure. Overall, in the FEAR approach, the role of the interatomic potential is only to discriminate the stable from unstable structures generated by RMC, which effectively mitigates the ill-defined nature of RMC refinement.

F(Q) (A and B) and ring size distribution (C and D) computed by FEAR while using different interatomic potentials. Results are presented for the (A and C) silica and (B and D) Jade glasses.