
The energy sector posted a gain during the final quarter of 2019. In Q4, energy commodities rebounded by 3.38%. In 2019, the sector was 15.11% higher than at the end of 2018.
WTI and Brent crude oil posted significant gains on the year, but the prices had declined to low levels at the end of 2018. Oil product prices followed, with gasoline and heating oil moving higher during Q4 and for the year.
In the natural gas market, the memories of the move to the highest price since 2014 in mid-November when nearby futures rose to $4.929 per MMBtu have faded into the market’s rearview mirror. In early August, natural gas fell to a low at $2.029 per MMBtu, which turned out to be a bottom for the energy commodity. The price of nearby natural gas futures rallied and moved over the technical resistance level at $2.53 per MMBtu in September before failing at over the $2.70 level. The pre-winter rally was brief with the nearby futures contract rising to a high at $2.905 but selling took the price below the $2.20 level in December.
The energy sector of the commodities market will reflect the economic and geopolitical landscapes as we move into 2020. The Middle East, which is home to more than half the world’s oil reserves, remains the most turbulent region on the earth. At the same time, Venezuela is a political and economic mess, which means the nation with the leading petroleum reserves in the world is not likely to see oil output increase any time soon. When it comes to China, the “phase one” trade deal with the US in December could add to demand in 2020. OPEC cut production at its December meeting, which helped stabilized the price of crude oil. The US is the world’s leading producer of crude oil with a daily output climbing to a new record at 12.9 million barrels, according to the Energy Information Administration during Q4.
Energy commodities power the world. Bullish and bearish factors on the economic and political landscapes were pulling the price of petroleum in opposite directions throughout most of 2019. Nearby NYMEX crude oil futures experienced a spike to the upside in Q3 after an attack on Saudi production on September 14. However, the price came back down by the end of the year as Saudi output returned to normal levels two weeks after the attack. The price remained below the high that followed the attack for the rest of 2019.
Natural gas was weak as the price action moving into the winter months reflected a much higher level than last year during the final quarter. Meanwhile, the price of ethanol posted a significant loss in Q4 but was still higher in 2019 compared to the end of the previous year.
On the second day of 2020, US airstrikes killed the highest-profile Iranian military commander, the leader of the Iranian Revolutionary Guard. General Soleimani appears to be responsible for siege on the US embassy in Baghdad in late December. The quick response raised the political temperature in the region to a boiling point. Crude oil rallied to new highs on Tuesday evening in the US in the aftermath of the death of the Iranian General. It followed through on the upside on Friday, January 3.
Crude Oil Review
Crude oil traded within the 2019 range in Q4 as the price traded from a low at $50.99 to a high at $62.34 on the nearby NYMEX futures contract.
In Q4, the nearby futures rose by 12.93%. In 2019, the price of WTI crude oil was 34.46% higher than at the end of 2018. The nearby futures contract settled at $61.06 per barrel on December 31. NYMEX WTI crude traded in a range from $45.52 to $66.60 in 2019.
We have seen lots of price action in the crude oil market since October 2018.
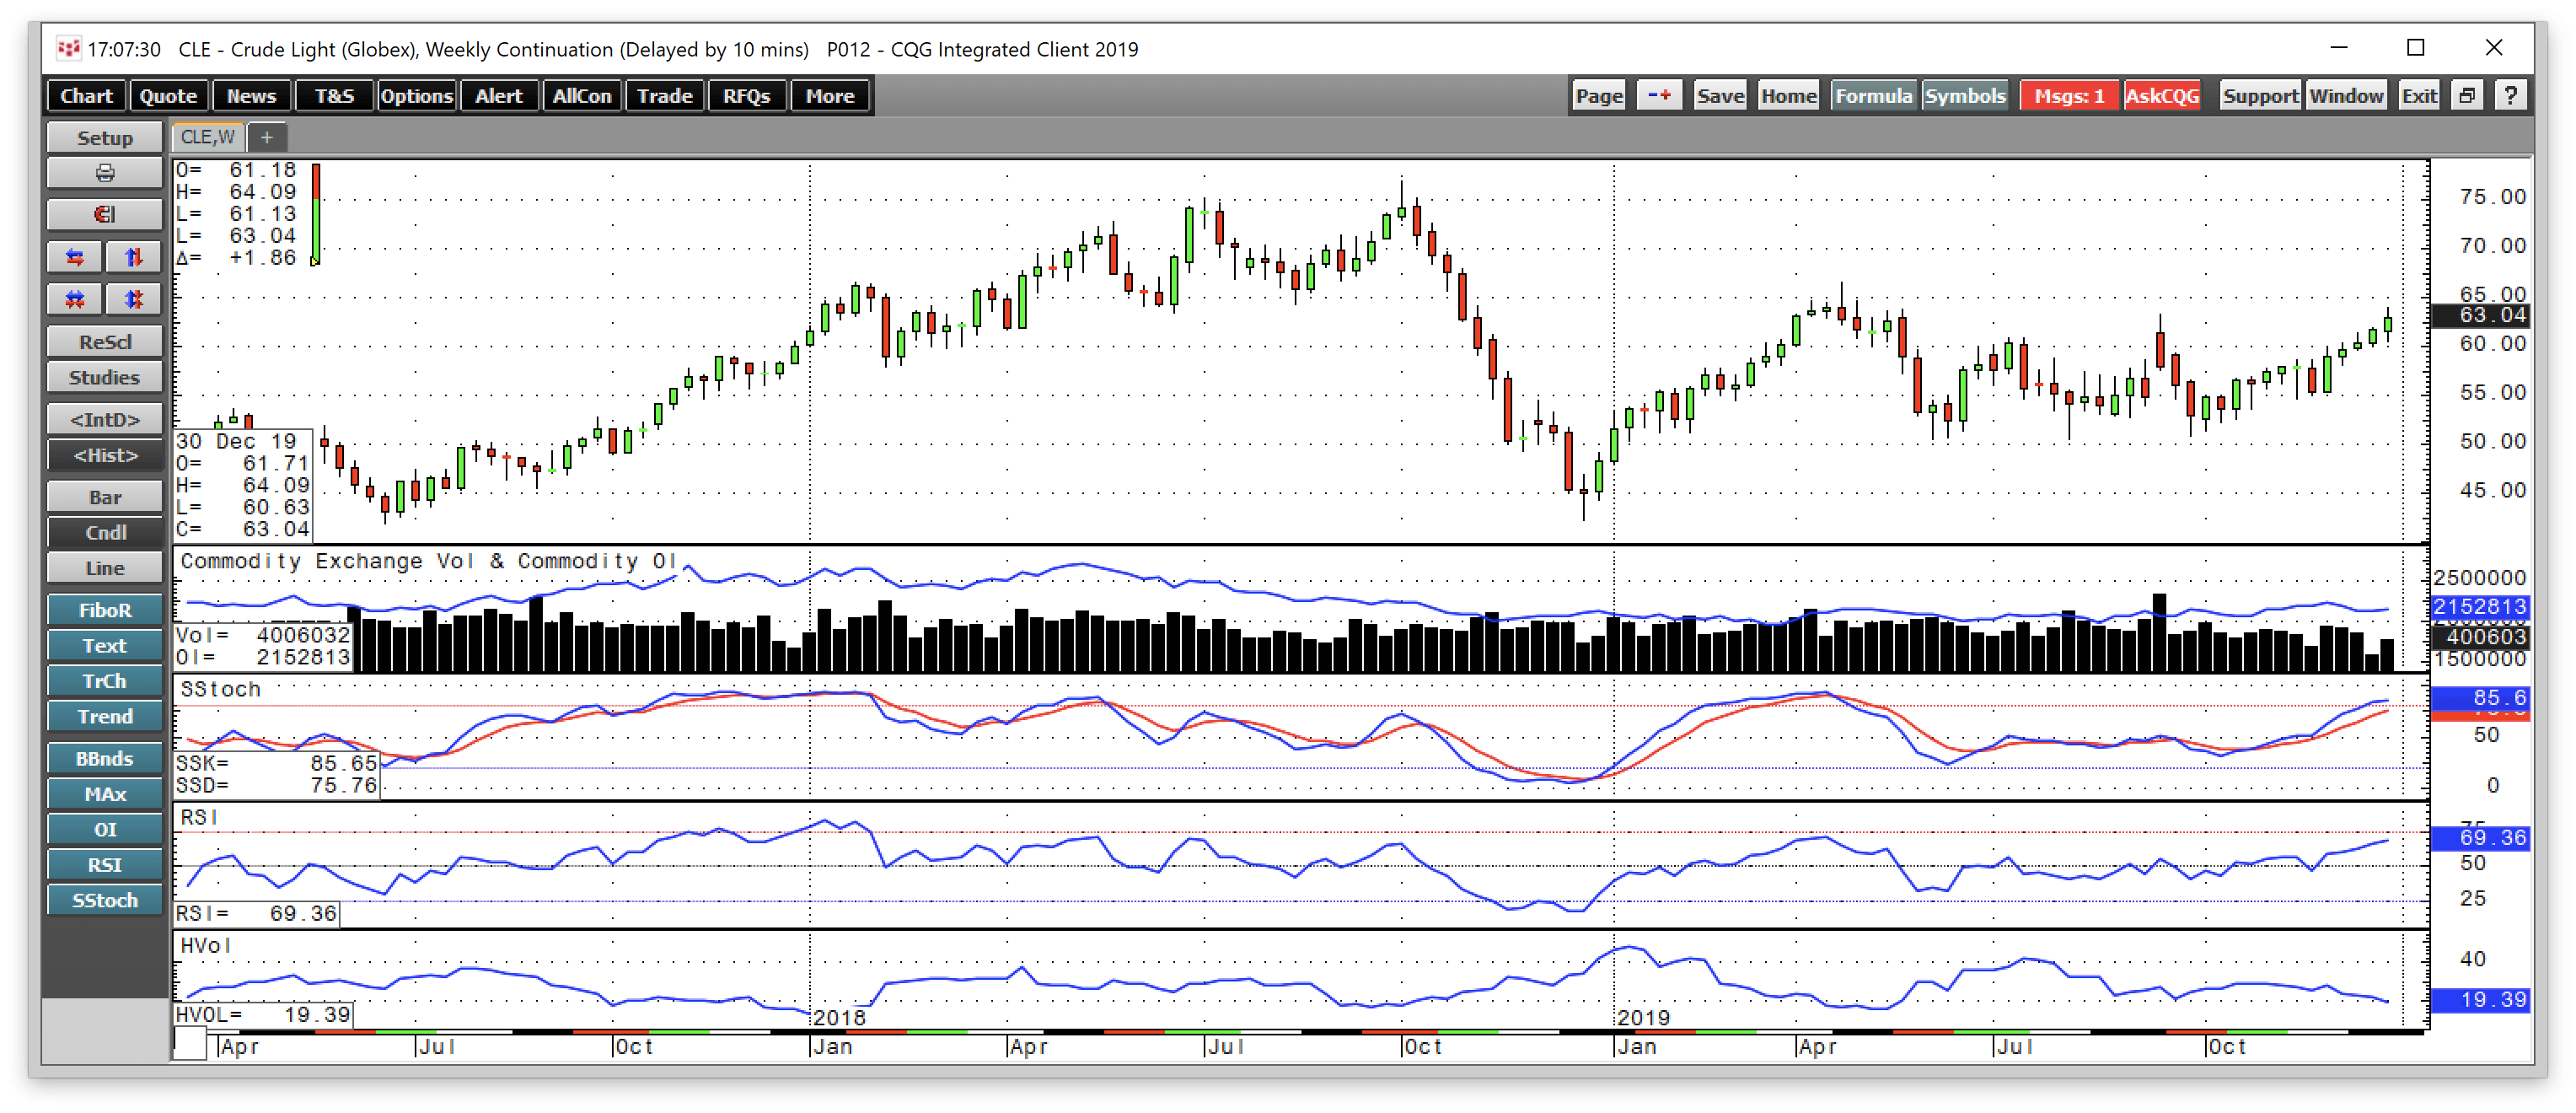
Source: CQG
The weekly chart illustrates the fall in Q4 2018 and price recovery in Q1 and Q2 2019, but the price ran out of upside steam in late April and declined. The September 14 attack that knocked out 50% of Saudi petroleum production, which amounts to 6% of world supplies, sent the price the high of the quarter at $63.38 on September 16. However, no retaliation or further event caused the price of oil to move back to just under $51 during the first week of October. The price of oil rallied steadily throughout the final quarter of 2019.
The US is the leading producer of crude oil in the world as output reached a record high at 12.9 million barrels per day during Q4. At the December OPEC meeting, the cartel increased its production cut from 1.2 to 1.7 million barrels per day for the first half of 2020. The Saudis added another 400,000 barrels per day for good measure bringing the effective reduction to 2.1 million barrels per day. The move by OPEC stabilized the oil market. The production cut together with a “phase one” deal on trade between the US and China lifted the nearby NYMEX futures contract to the $60 per barrel level in December. In a sign that US production has become more efficient, the rig count, according to Baker Hughes, fell over the past three months and stood at 670 as of January 3, 2020, 43 lower than at the end of Q3. Meanwhile, even though the rig count fell, production continued to rise to a new record high in the US.
Fewer regulations under the Trump administration and a more favorable corporate tax policy improved the economics for U.S. producers, and the American oil industry has become a significant exporter of crude oil in the future. The U.S. is now the world’s swing producer of the energy commodity. When the price declines, shale output will decline, and the U.S. can import cheaper oil from abroad. However, when the price rises, American shale production will flow, and the U.S. will compete with other world producers to supply the energy commodity around the globe, and even to the Chinese now that there has been progress and a de-escalation of the trade war.
The issues facing the Middle East remained a substantial concern in Q4 and reached a new peak in early 2020, which could impact global supplies of the energy commodity this year. However, the US achieved its goal of energy independence because of technology and a friendlier regulatory environment. With the 2020 election on the horizon, climate change is likely to be a significant topic of discussion. In Q4, many of the candidates from the other side of the political aisle have rolled out platforms for the environment. At the end of Q3 in September, one of the leading candidates, Elizabeth Warren said she would ban fracking on day-one of her administration. The election will likely serve as an energy referendum for the US as the Democrats are likely to adopt parts of the progressive agenda including the “Green New Deal.”
Trade issues between the U.S. and China de-escalated at the end of Q4. At the start of August, the US slapped new tariffs on China, and the Chinese retaliated. The fears of a worldwide recession as a result of economic weakness in China and contagion around the world sent the price of oil to the lows of the quarter at $50.52 per barrel during the week of August 5. However, some optimism returned to the market in September, and the attack was another example of the political risk in the world’s most turbulent region. In December, the “phase one” trade deal that followed the OPEC production cuts lifted the price of NYMEX crude oil over the $60 per barrel level.
Iran continues to be a clear and present danger in the Middle East. The Strait of Hormuz is likely to remain a hub of international concern over the coming weeks and months. Any increase in hostile actions in the Middle East that impact production, refining, or logistical routes like the Strait of Hormuz could cause availability problems around the world. As the Strait is now a focal point, we have witnessed a military buildup in the area, which raises the political temperature in the region.
Saudi Arabia depends on the US for military support in the region, given its ongoing battles with Iran. However, they have also been maintaining close ties with Russian President Putin. The position of Saudi Arabia and their relationships with the US, Russia, and their neighbors in the Middle East creates a complex puzzle that could impact the price of oil in the months ahead.
The three dominant oil producers in the world are the Saudis, Russians, and the United States. It is in the best interest of all three nations for the oil price to remain at a level that is high enough to allow oil and profits, but low enough to keep inflationary pressures in check.
The past year and three months were a highly volatile period in the crude oil market; the energy commodity took the elevator to the downside in Q4, and the stairs higher in Q1. In Q2, it rallied until late April when selling once again hit the market. In Q3, the price spike on September 16 gave way to selling that took the price back below $51 per barrel. In Q4, oil rebounded on the back of a deeper OPEC production cut and a de-escalation in the trade war. Trade and Iran have been the most significant factors for the oil market over the past three months. In 2020, the future of US energy policy could take the center of the stage and cause price variance in the energy commodity.
In Q4, Brent futures lagged WTI as it posted an 11.38% gain. In 2019, the price of Brent crude oil was 22.66% higher than at the end of 2018. Nearby Brent futures closed on December 31 at $65.99 per barrel as the February contract rolled to March on the final day of the year. Brent traded in a range from $53.47 to $75.59 in 2019. After the September 14 attack, the price of nearby Brent futures moved to a high at $71 per barrel but did not return to the level in Q4.
Brent’s premium to WTI decreased to $5.26 per barrel basis the nearby March contracts down $0.11 per barrel in Q4. The Brent premium traded to the highest level since March 2015 at $11.59 per barrel in May. In Q4, the range in the spread was from $4.65 to $7.15 per barrel, and it closed the quarter closer to the low. The expansion of the US pipeline system has weighed on the spread, and the calm in the Middle East over the past three months also contributed to the decline in Brent’s premium over WTI crude oil.
NYMEX crude oil moved 12.93% higher over the past three months, and the XLE only posted a marginal gain in the final quarter. The ETF closed at $59.20 on the final day of trading in Q3 was at the $60.04 level on December 31, an increase of $0.84 or 1.42% over the period. The XLE lagged the price action in both the crude oil and stock markets in Q4. The potential for a shift in US energy policy starting in 2021 could be weighing on the prices of oil-related shares.
Bullish and bearish factors will continue to pull the price of crude oil in opposite directions in 2020 as the situation between Iran, the Saudis, and the US is not going away any time soon. The Middle East and even Venezuela are extreme hotspots in the world, and trade between the Progress on trade between the US and China will determine the health of the global economy. The “phase one” deal at the end of Q4 was a positive sign for the crude oil market. I believe that any price spikes in 2020 are likely to come on the upside because of the tension around the Strait of Hormuz and increased military presence in the region. Iran remains a clear and present danger in the part of the world that is home to over half the world’s oil reserves as we were reminded on January 2.
Oil Products Review
Oil products often reflect periods of seasonal demand, but they also are a piece of a complex puzzle when it comes to the price direction of crude oil, which is the critical input when it comes to the refining process. RBOB gasoline tends to rally in the spring and summer, and heating oil or distillates tend to do best during late fall and winter, although they exhibit less seasonality than the gasoline futures market.
Both gasoline and heating oil futures rose in Q4. Meanwhile, the products diverged slightly from their seasonal patterns as gasoline rose more on a percentage basis than heating oil futures. Refining margins on both moved lower as the products underperformed the price action in the crude oil futures market.
In Q4, gasoline moved 7.92% higher and was 29.83% higher in 2019 compared to the closing price at the end of 2018.
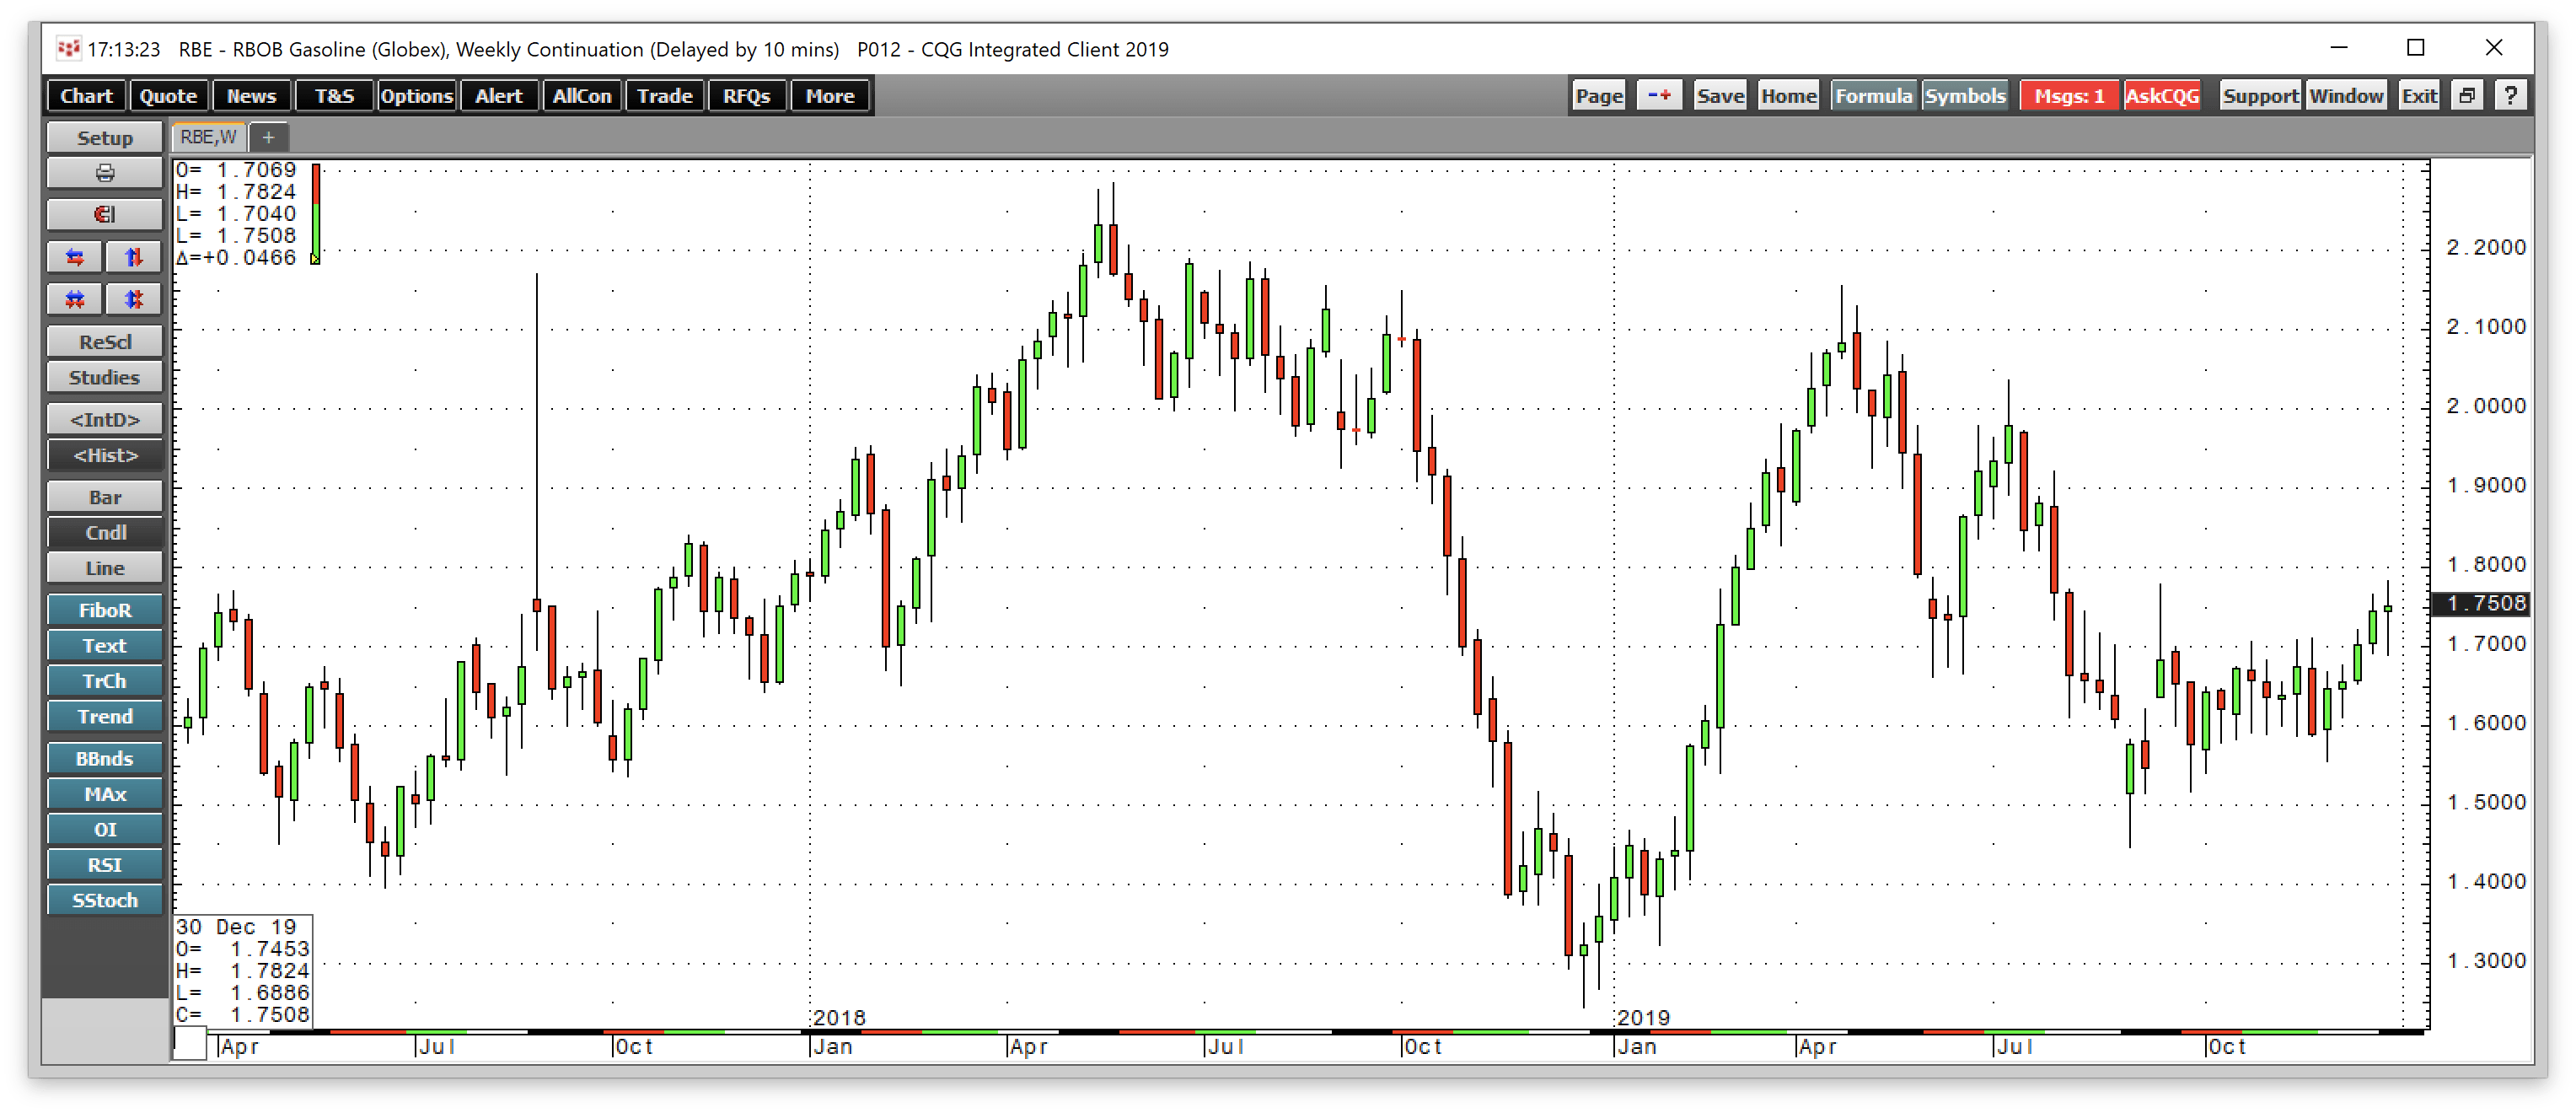
Source: CQG
As the weekly chart highlights, gasoline traded in a range of $1.3230 per gallon to $2.1559 on the active month contract on the NYMEX in 2019. The price pattern on the weekly chart since early 2016 had been positive as gasoline has made higher lows and higher highs. However, seven consecutive weeks of losses ended that bullish price trend in Q4 2018. In Q1, eight straight weeks of gains sent the price back to the highest level since last October. The price of gasoline futures moved steadily lower with crude oil after hitting a high during the week of April 22. The fuel traded in a range since late September. Nearby futures closed on December 31, at $1.69050 per gallon wholesale. Gasoline spiked higher with crude oil on September 16 to $1.7785, but the price settled into a trading range over the rest of the year.
In Q4, the heating oil futures rose by 6.62% and were 20.45% higher in 2019. Heating oil futures are a proxy for diesel and jet fuel as the oil products are all distillates and have similar characteristics. Heating oil futures have some seasonal features, but less than gasoline as jet, diesel, and other distillates are year-round fuels.
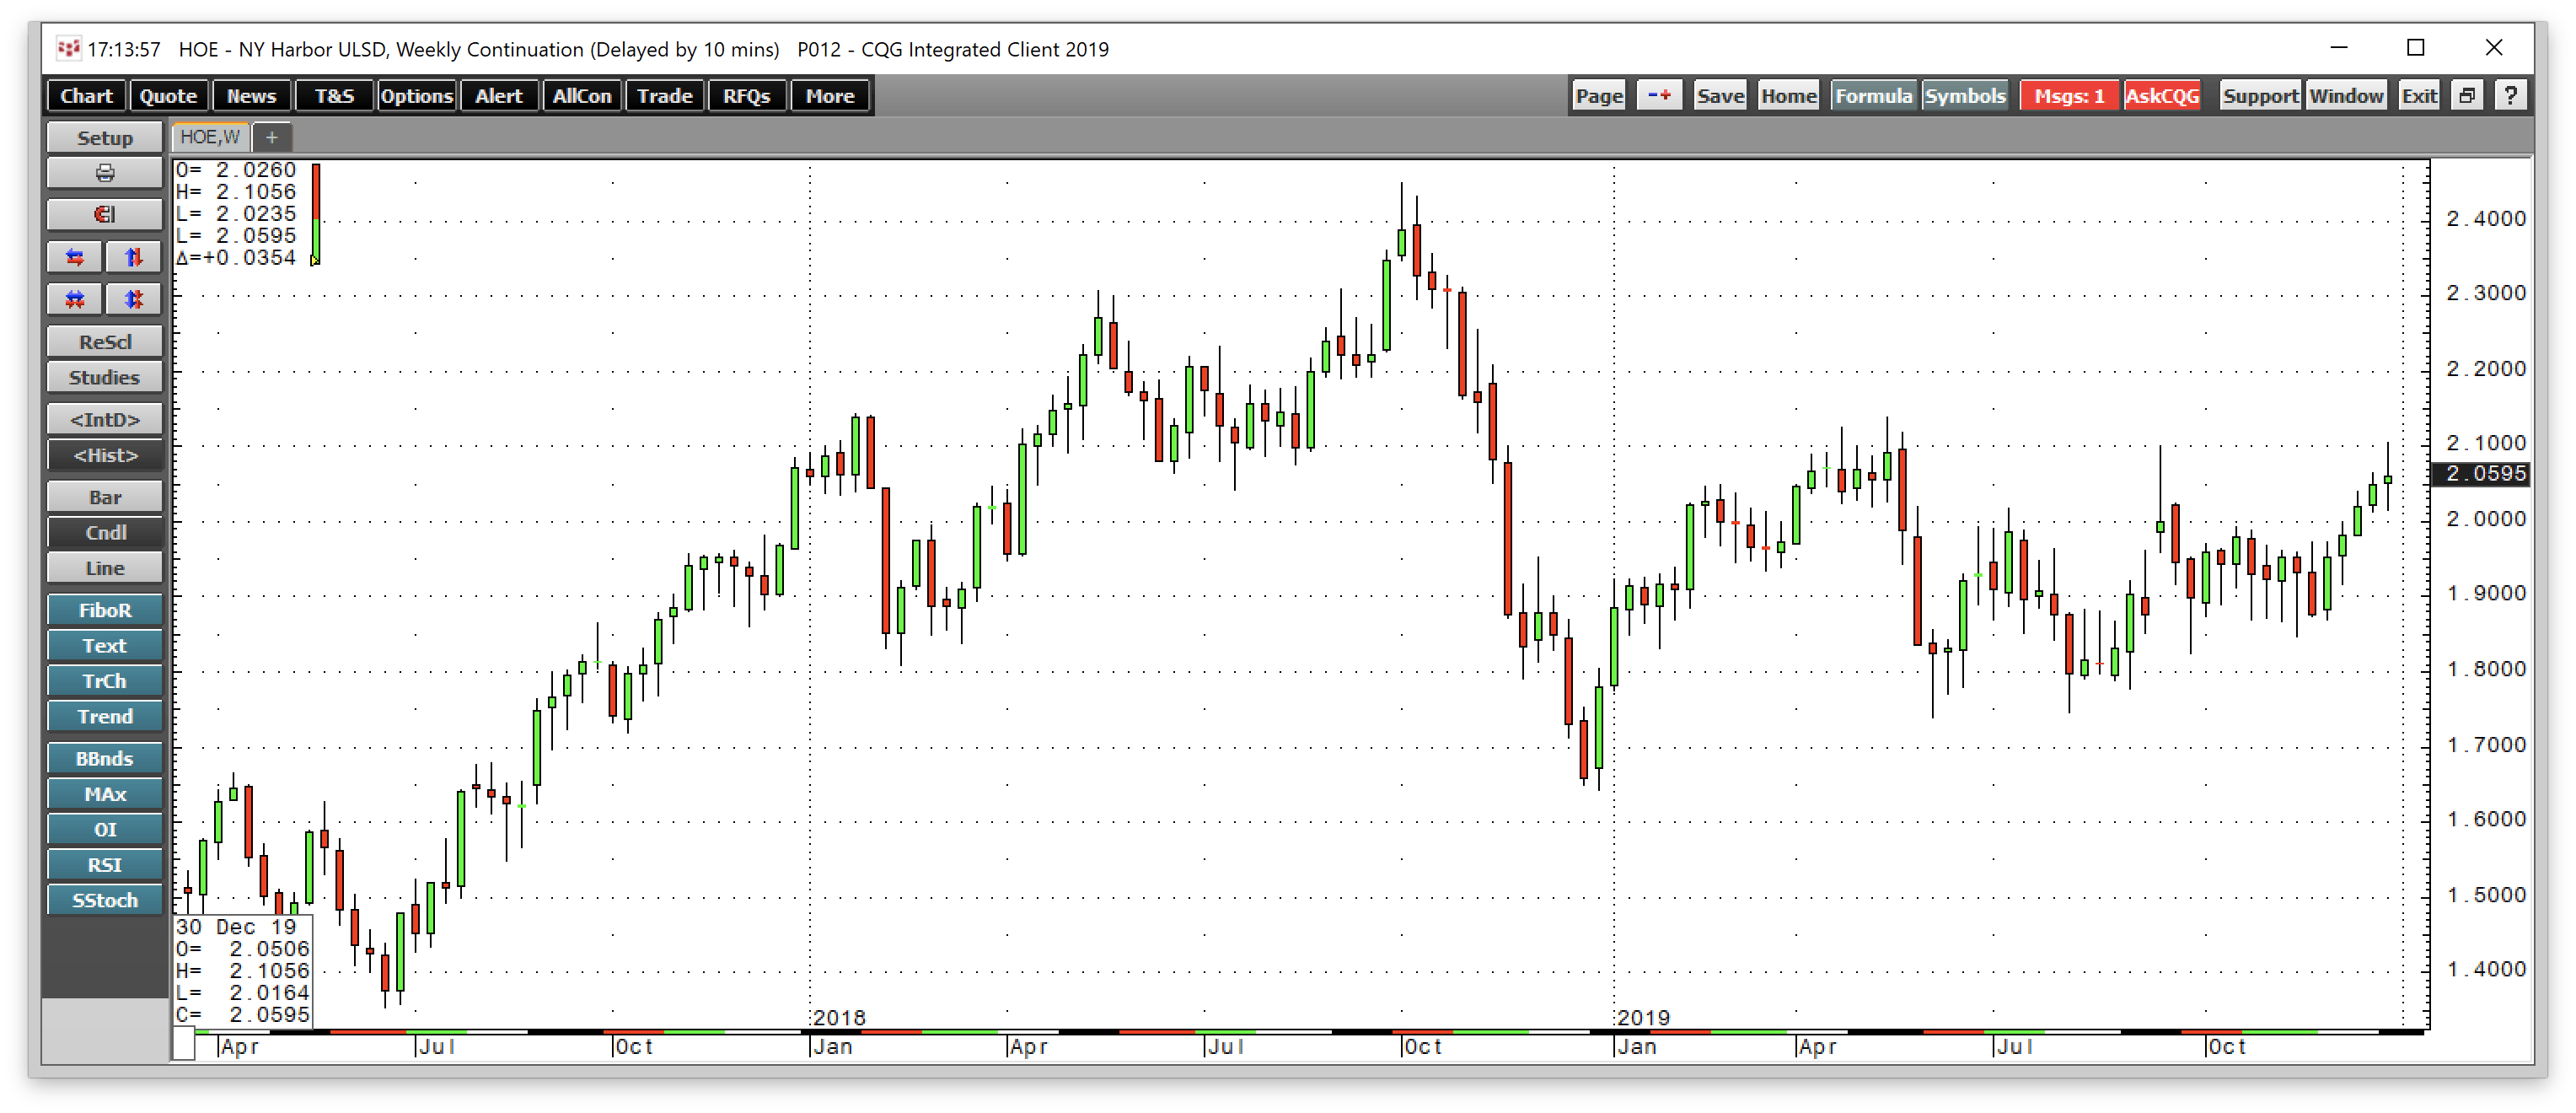
Source: CQG
The weekly heating oil chart shows a constructive and bullish trend since early 2016. The price carnage in the crude oil market took the price to a low at $1.6424 per gallon in late December 2018 on the continuous contract before recovering with the price of oil.
Nearby heating oil futures closed on the final trading day of Q4 at $2.02280 per gallon wholesale. Heating oil traded in a range from $1.6215 to $2.1377 per gallon in 2019. Oil products rose with the price of oil in Q4, and both moved higher in 2019. Gasoline outperformed heating oil in the year that ended on December 31.
Crack Spreads Review
The price action in crack or refining spreads shows that gasoline and distillate fuel processing margins moved lower during the final quarter of 2019.
In Q4, the offseason for gasoline demand, the gasoline crack fell by 14.30% but was still 7.63% higher compared to the price at the end of 2018.
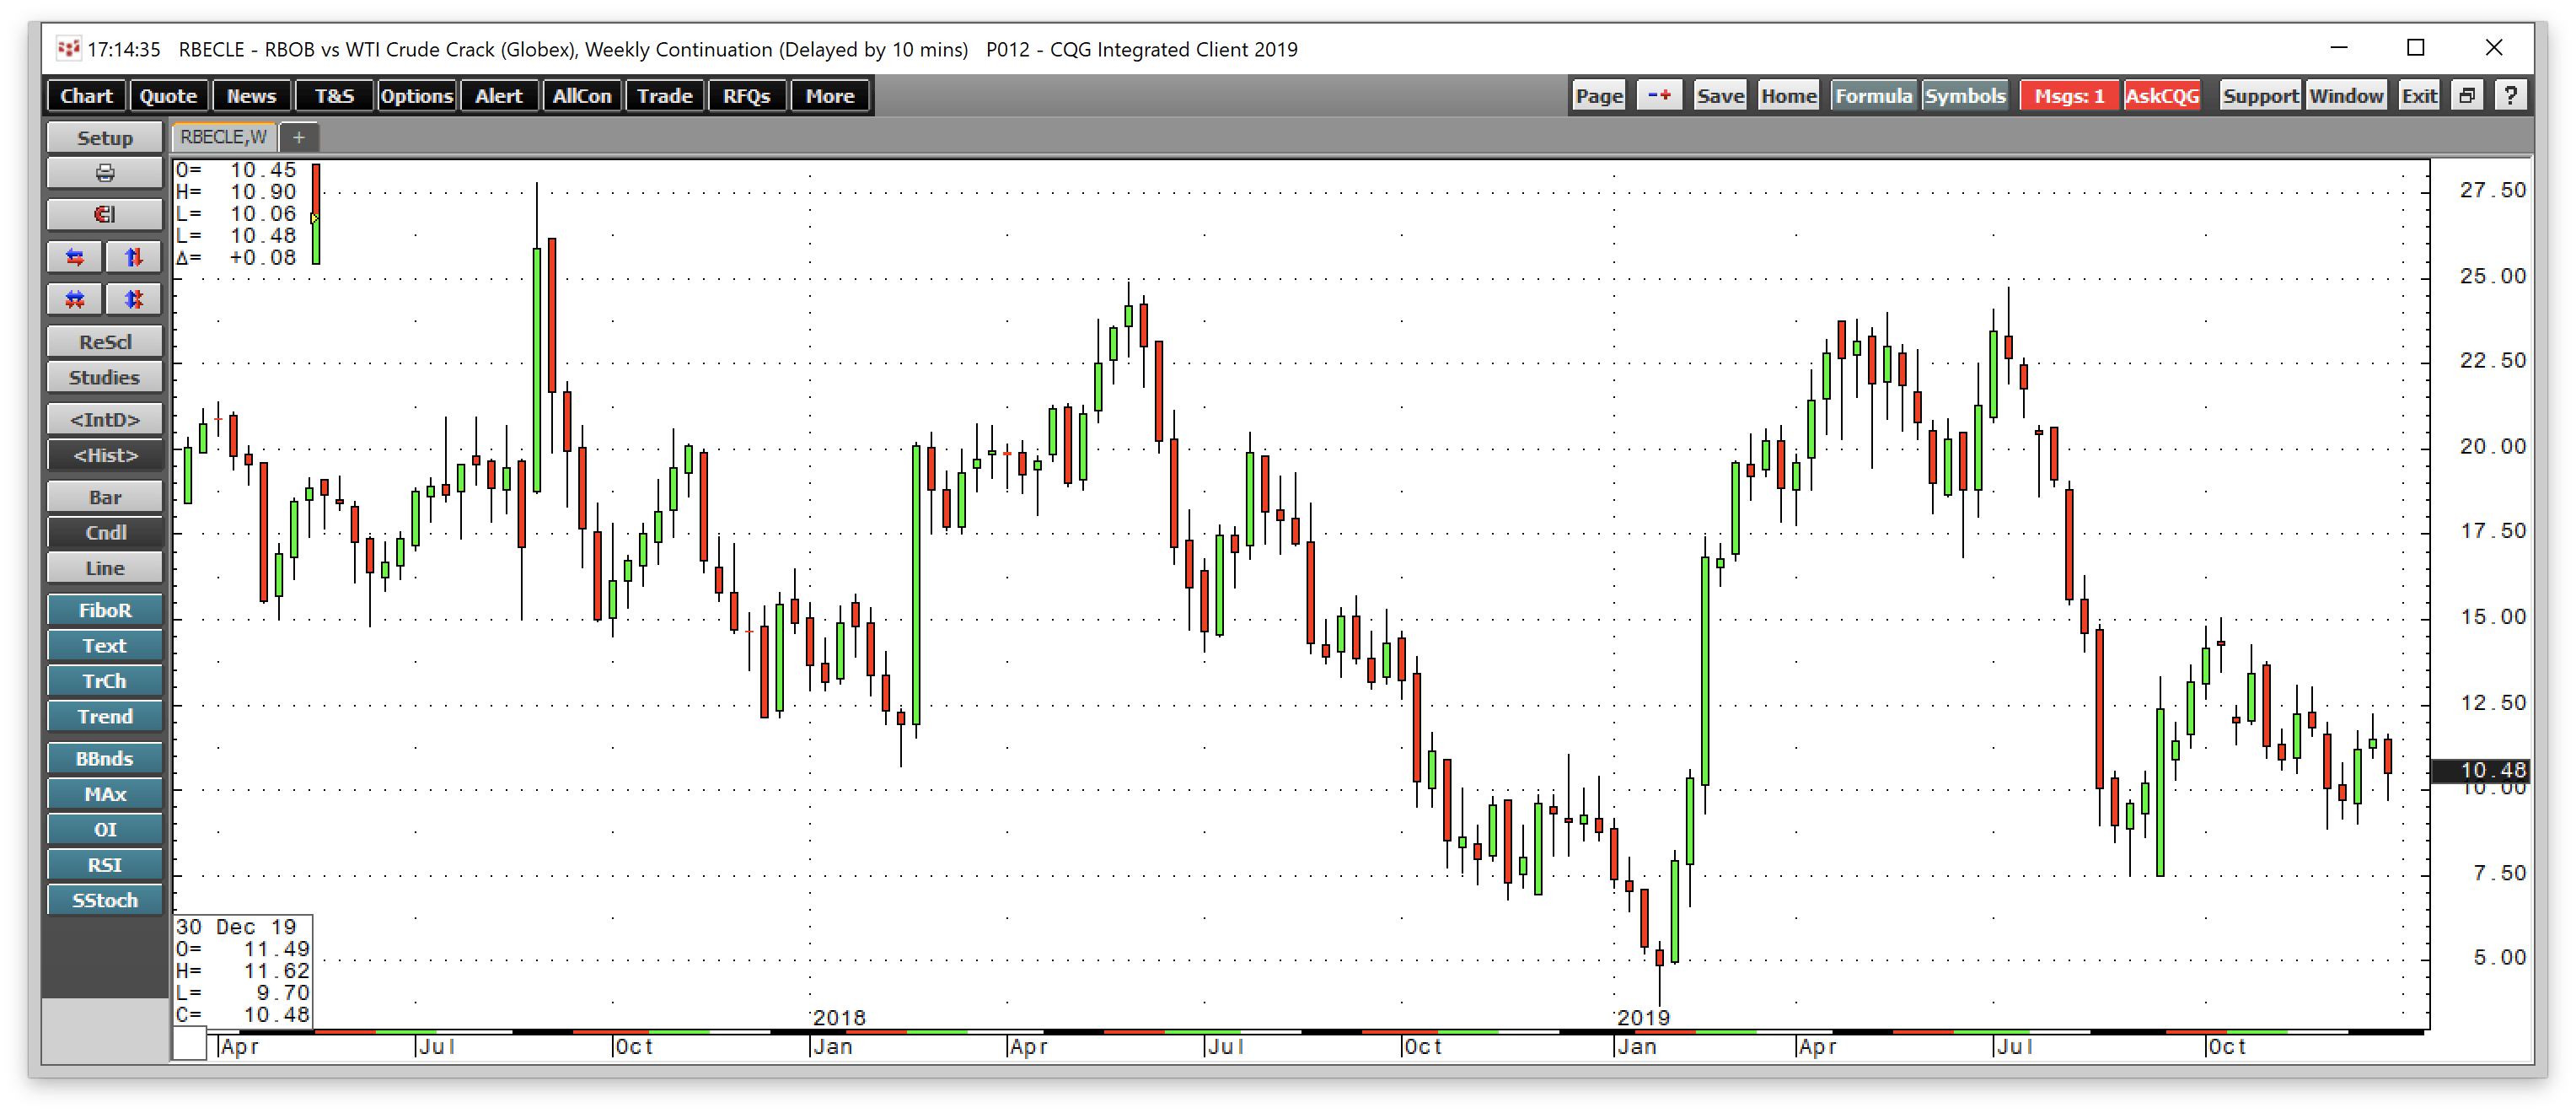
Source: CQG
As the weekly chart shows, the nearby NYMEX gasoline processing spread exploded higher in Q1 as the market looked forward to the season of peak demand. In Q2, the gasoline crack spread retained most of its gains, but the seasonal pull caused the spread to move into winter mode as the end of summer approached. The nearby gasoline crack spread closed Q4 at $10.01 per barrel on December 31. The gasoline crack spread was higher at the end of Q4 in 2019 compared to Q4 2018 when it closed at $9.30 per barrel.
In Q4, the heating oil crack fell 6.60%.
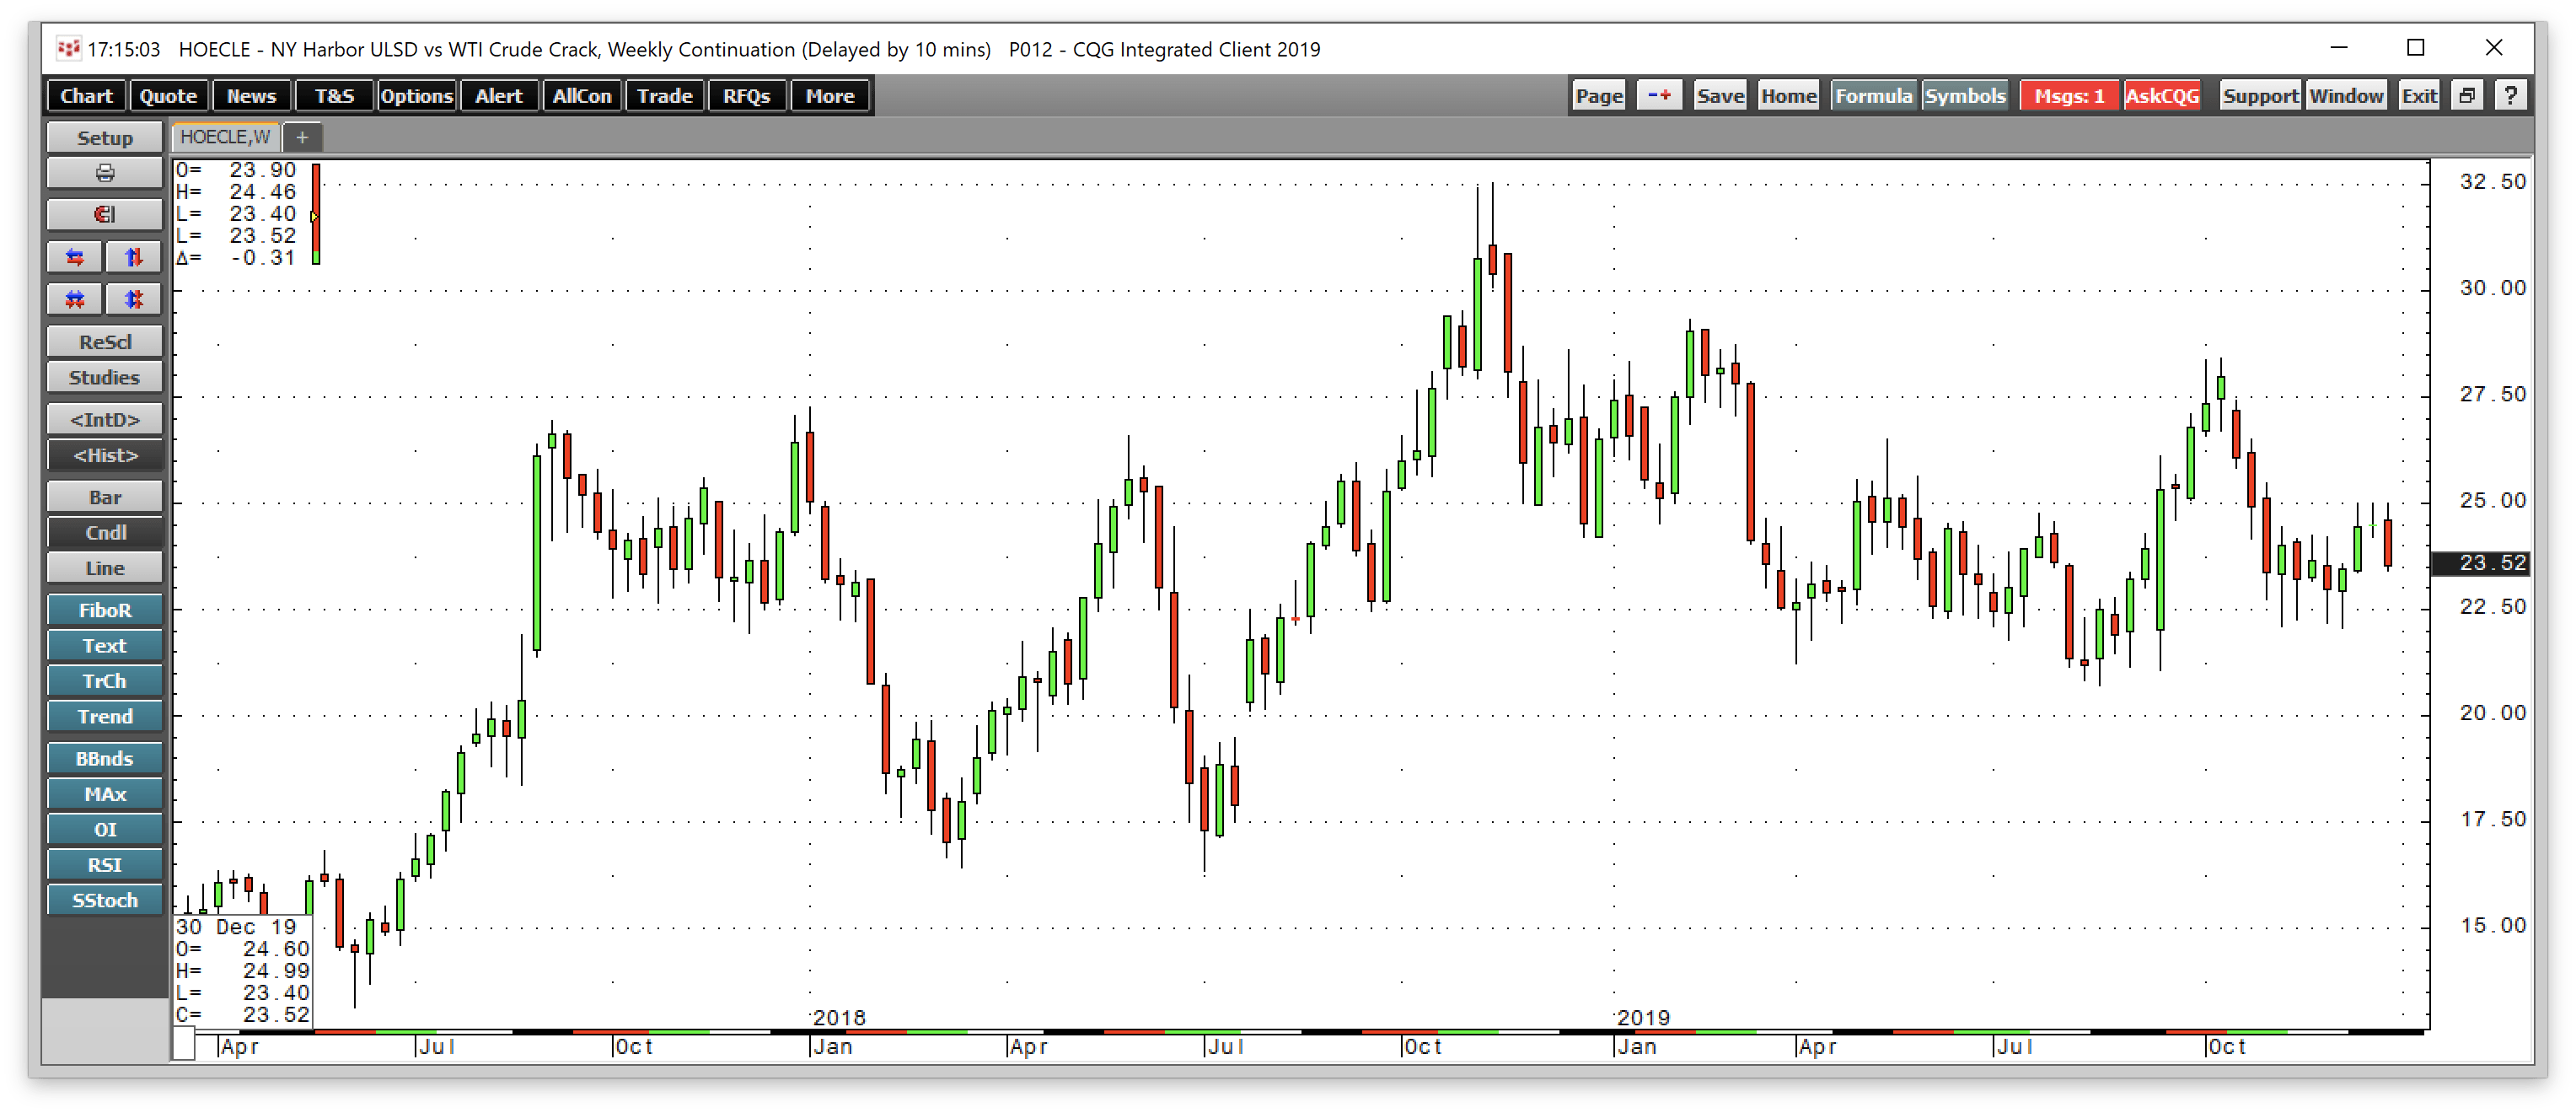
Source: CQG
The weekly pictorial of the heating oil refining spread illustrates that it closed Q4 at $23.90 per barrel. The heating oil crack spread had been under pressure since 2013, but the price action in 2016 and 2017 broke the pattern of lower highs. The processing spread between crude oil and distillates made a higher high in mid-November 2018 at $32.53 per barrel before turning lower. At $23.90 at the end of 2019, the refining spread was lower than it was last year at the time, as it closed Q4 2018 at $25.09 per barrel.
Natural Gas Review
In Q4, despite the start of the winter season, natural gas futures posted a loss of 6.05% and was 25.54% lower in 2019.
Natural gas was a wild ride in Q4 2018 as the price traded to a high at $4.929 per MMBtu in mid-November and then fell like a stone reaching a low at $2.543 per MMBtu in mid-February 2019. Natural gas rallied at the beginning of the peak season of demand late last year on the lowest level of inventories in years, but the price came back down to earth in December and during the first three months of 2019. During the third quarter, the selling continued taking the price to a low at $2.029 per MMBtu in August. In Q4, high levels of inventories stifled any chance of a peak demand season rally.
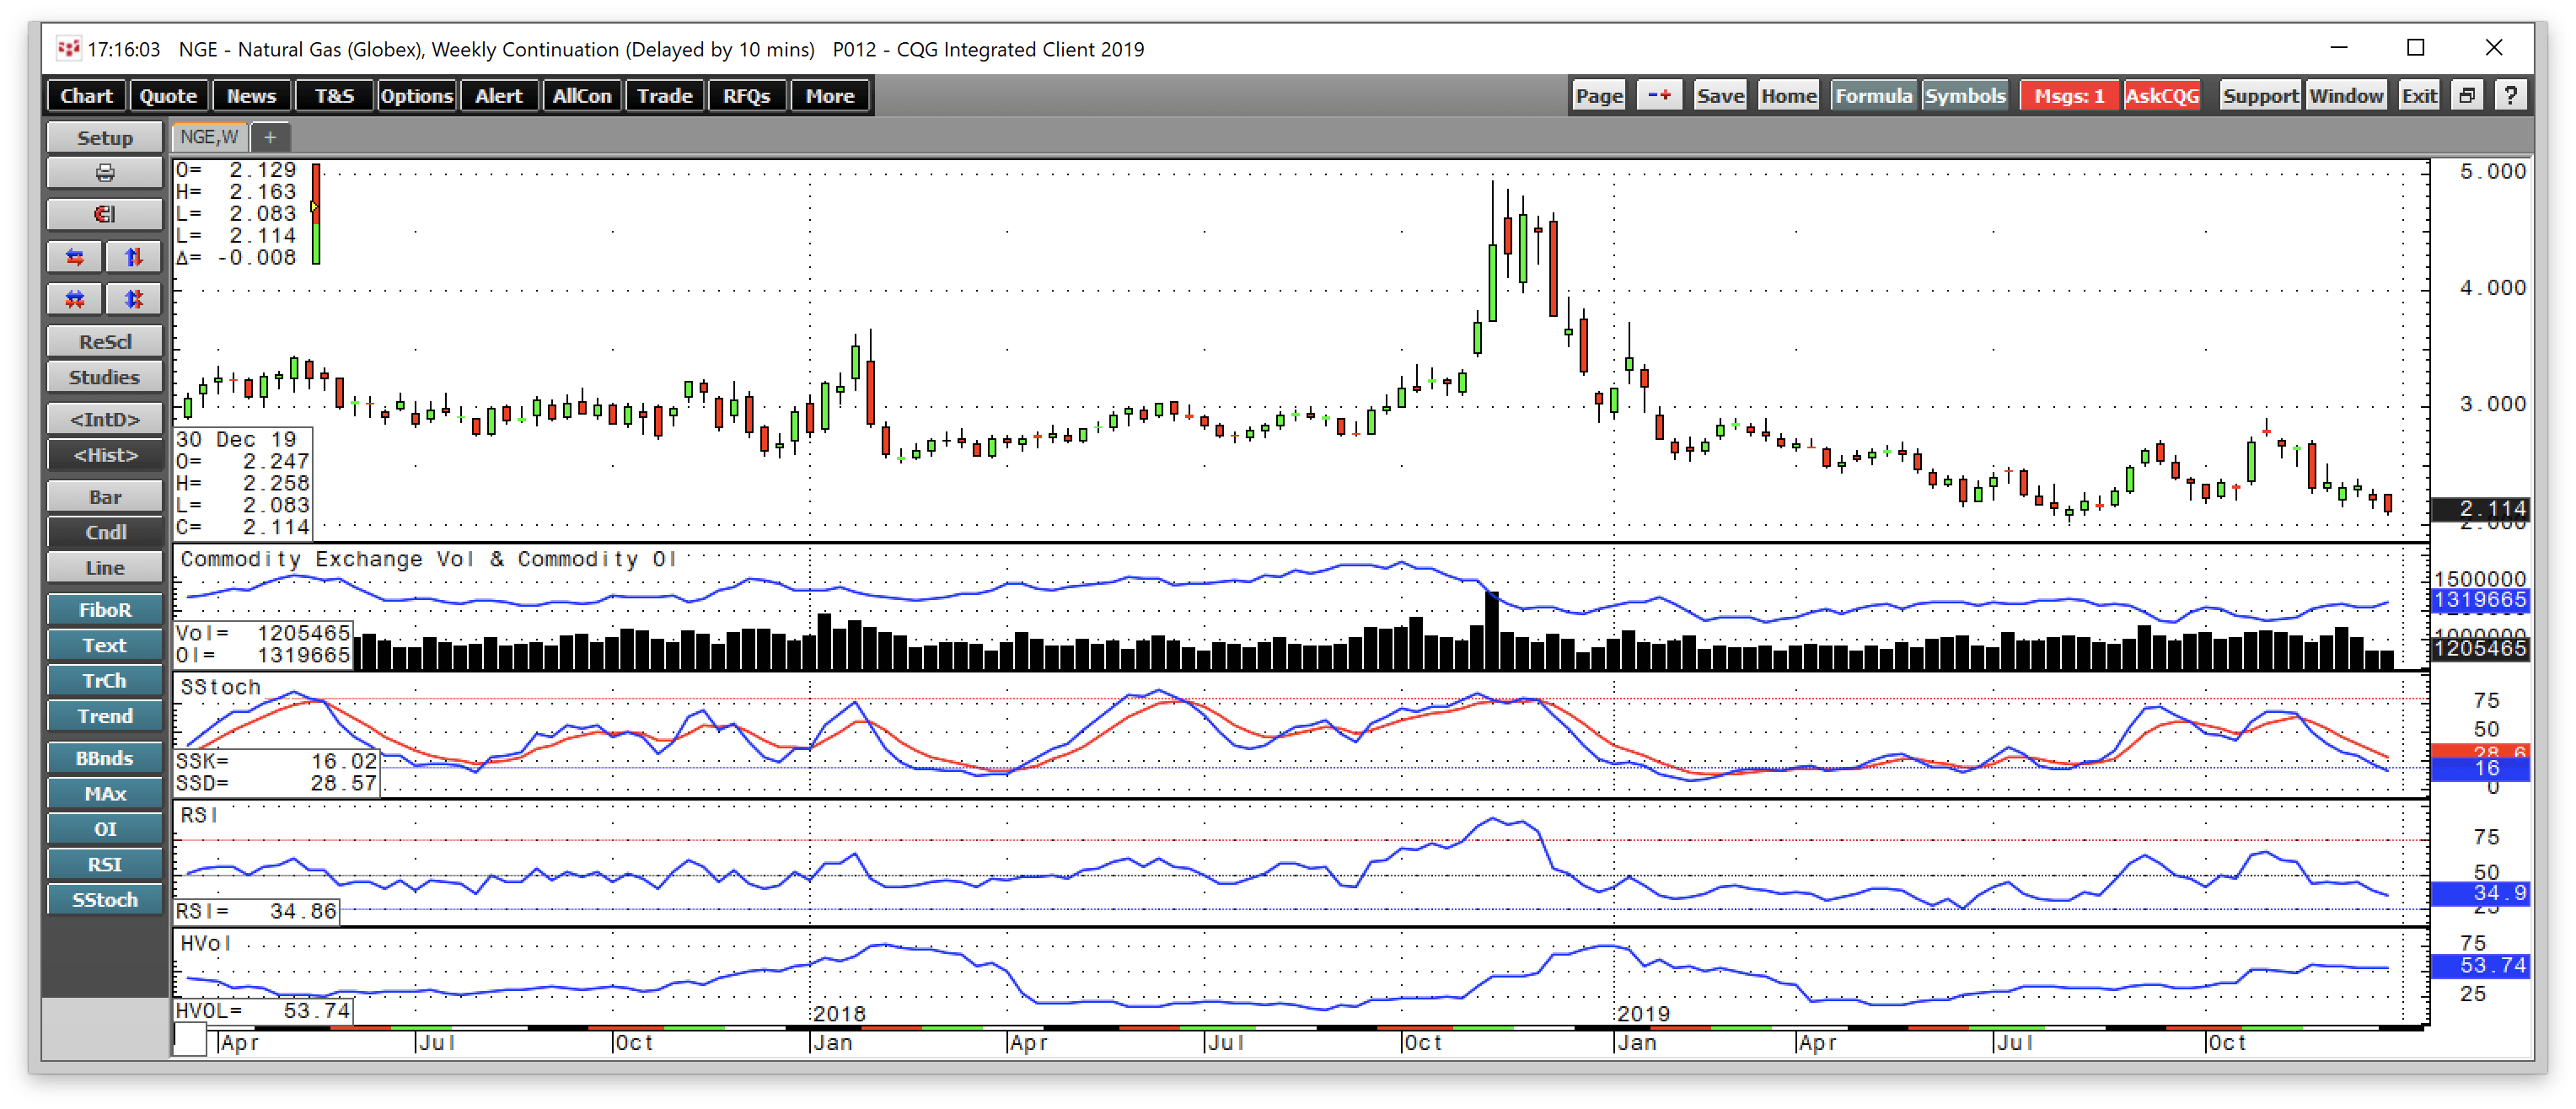
Source: CQG
As the weekly chart shows, the highs in natural gas came in mid-November when a combination of short-covering and cold weather took the price to a lower high at $4.929 per MMBtu. Record production caused some market participants to short the commodity, but low stocks and an increase in demand for power generation, and growing shipments of LNG supported the demand side of the fundamental equation for the natural gas market. Additionally, a pairs trade of long crude oil and short natural gas at the beginning of October as sanctions on Iran and record output of natural gas caused some traders and hedge funds to buy oil and sell gas on spread. The trade wound up being one of the most painful spreads of 2018 as longs scrambled to sell oil and shorts chased natural gas higher in Q4, resulting in significant losses on both sides of the pairs trade. However, warmer forecasts brought the price back below the $3 level by the end of 2018. The selling continued throughout 2019. Natural gas picked up a head of steam on the downside as the price fell below technical resistance levels at just above the $2.50 per MMBtu level. The price found a bottom at $2.029 per MMBtu during the week of August 5. In Q4, higher inventories than in 2018 weighed on the price of the energy commodity, pushing it to a low at $2.138 per MMBtu after the start of the 2019/2020 withdrawal season in 2019.
Nearby natural gas futures closed Q4 at $2.1890 per MMBtu. Technical support is at the recent low at $2.029 level. Resistance is at the $2.905 and $3 level as we head into 2020. A bearish island gap formation from early November from $2.738 to $2.753 stands as the first target on the upside in the natural gas futures market.
The price range in natural gas has been from lows of $1.02 to highs of $15.65 per MMBtu since 1990. A twelve-year price at below $4.00 became a bargain for a time in late 2018. Natural gas will move into the first quarter of the new decade with a threat to challenge the March 2016 low at $1.611 per MMBtu. The price action at the start of the peak winter season for demand was decidedly bearish.
Politics rather than inventories and the weather could be the most significant factor when it comes to the path of least resistance for the price of natural gas in 2020.
Ethanol
In Q4, ethanol corrected as the price fell by 12.53%. Ethanol futures moved 8.78% higher in 2019.
A significant issue to keep in mind when it comes to ethanol is the political push for a “Green New Deal” by Democrats in Congress and the candidates for President. Rising support from a move away from fossil fuels and hydrocarbons could boost the demand and price of ethanol and other alternative energy products, as we witnessed in the second quarter of 2019. The 2020 election could inject lots of volatility into the ethanol market as well as all in energy commodities.
The bottom line on energy
After falling from the high in mid-September to a low at $50.99 in early October, the price of crude oil made higher lows and higher highs. The OPEC production cut and “phase one” trade deal pushed the price back above the $60 per barrel on nearby NYMEX futures in December. Brent marginally underperformed WTI as the pipeline system in the US, expanded and allowed for increased exports. As we head into 2020, Iran and trade will continue to provide direction for the crude oil market. A weaker US dollar and lower US interest rates are not bearish for the price of crude oil. Increased tension after the US airstrike on January 2 has the potential to cause a significant move in the crude oil market in Q1.
When it comes to natural gas, the price goes into 2020 after a significant disappointment at the start of the 2019/2020 withdrawal season. It looks like natural gas could head for prices below the $2 level over the coming months.
The price of coal tends to be a seasonal commodity that follows the price of other energy products.
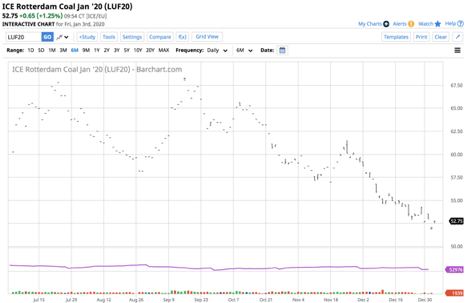
Source: Barchart
As the chart of the price of January coal futures for delivery in Rotterdam, the Netherlands shows, closed Q3 at $63.45 per ton and moved lower to $53.00 at the end of Q4, a decline of 16.5% in Q4 on the January contract. The price of Rotterdam coal futures underperformed both crude oil and natural gas in Q4, as coal has become a four-letter word for environmentalists in the energy sector.
The Vanguard Energy Index Fund ETF Shares (VDE) correlates with the price of crude oil, but it has lagged the energy commodity.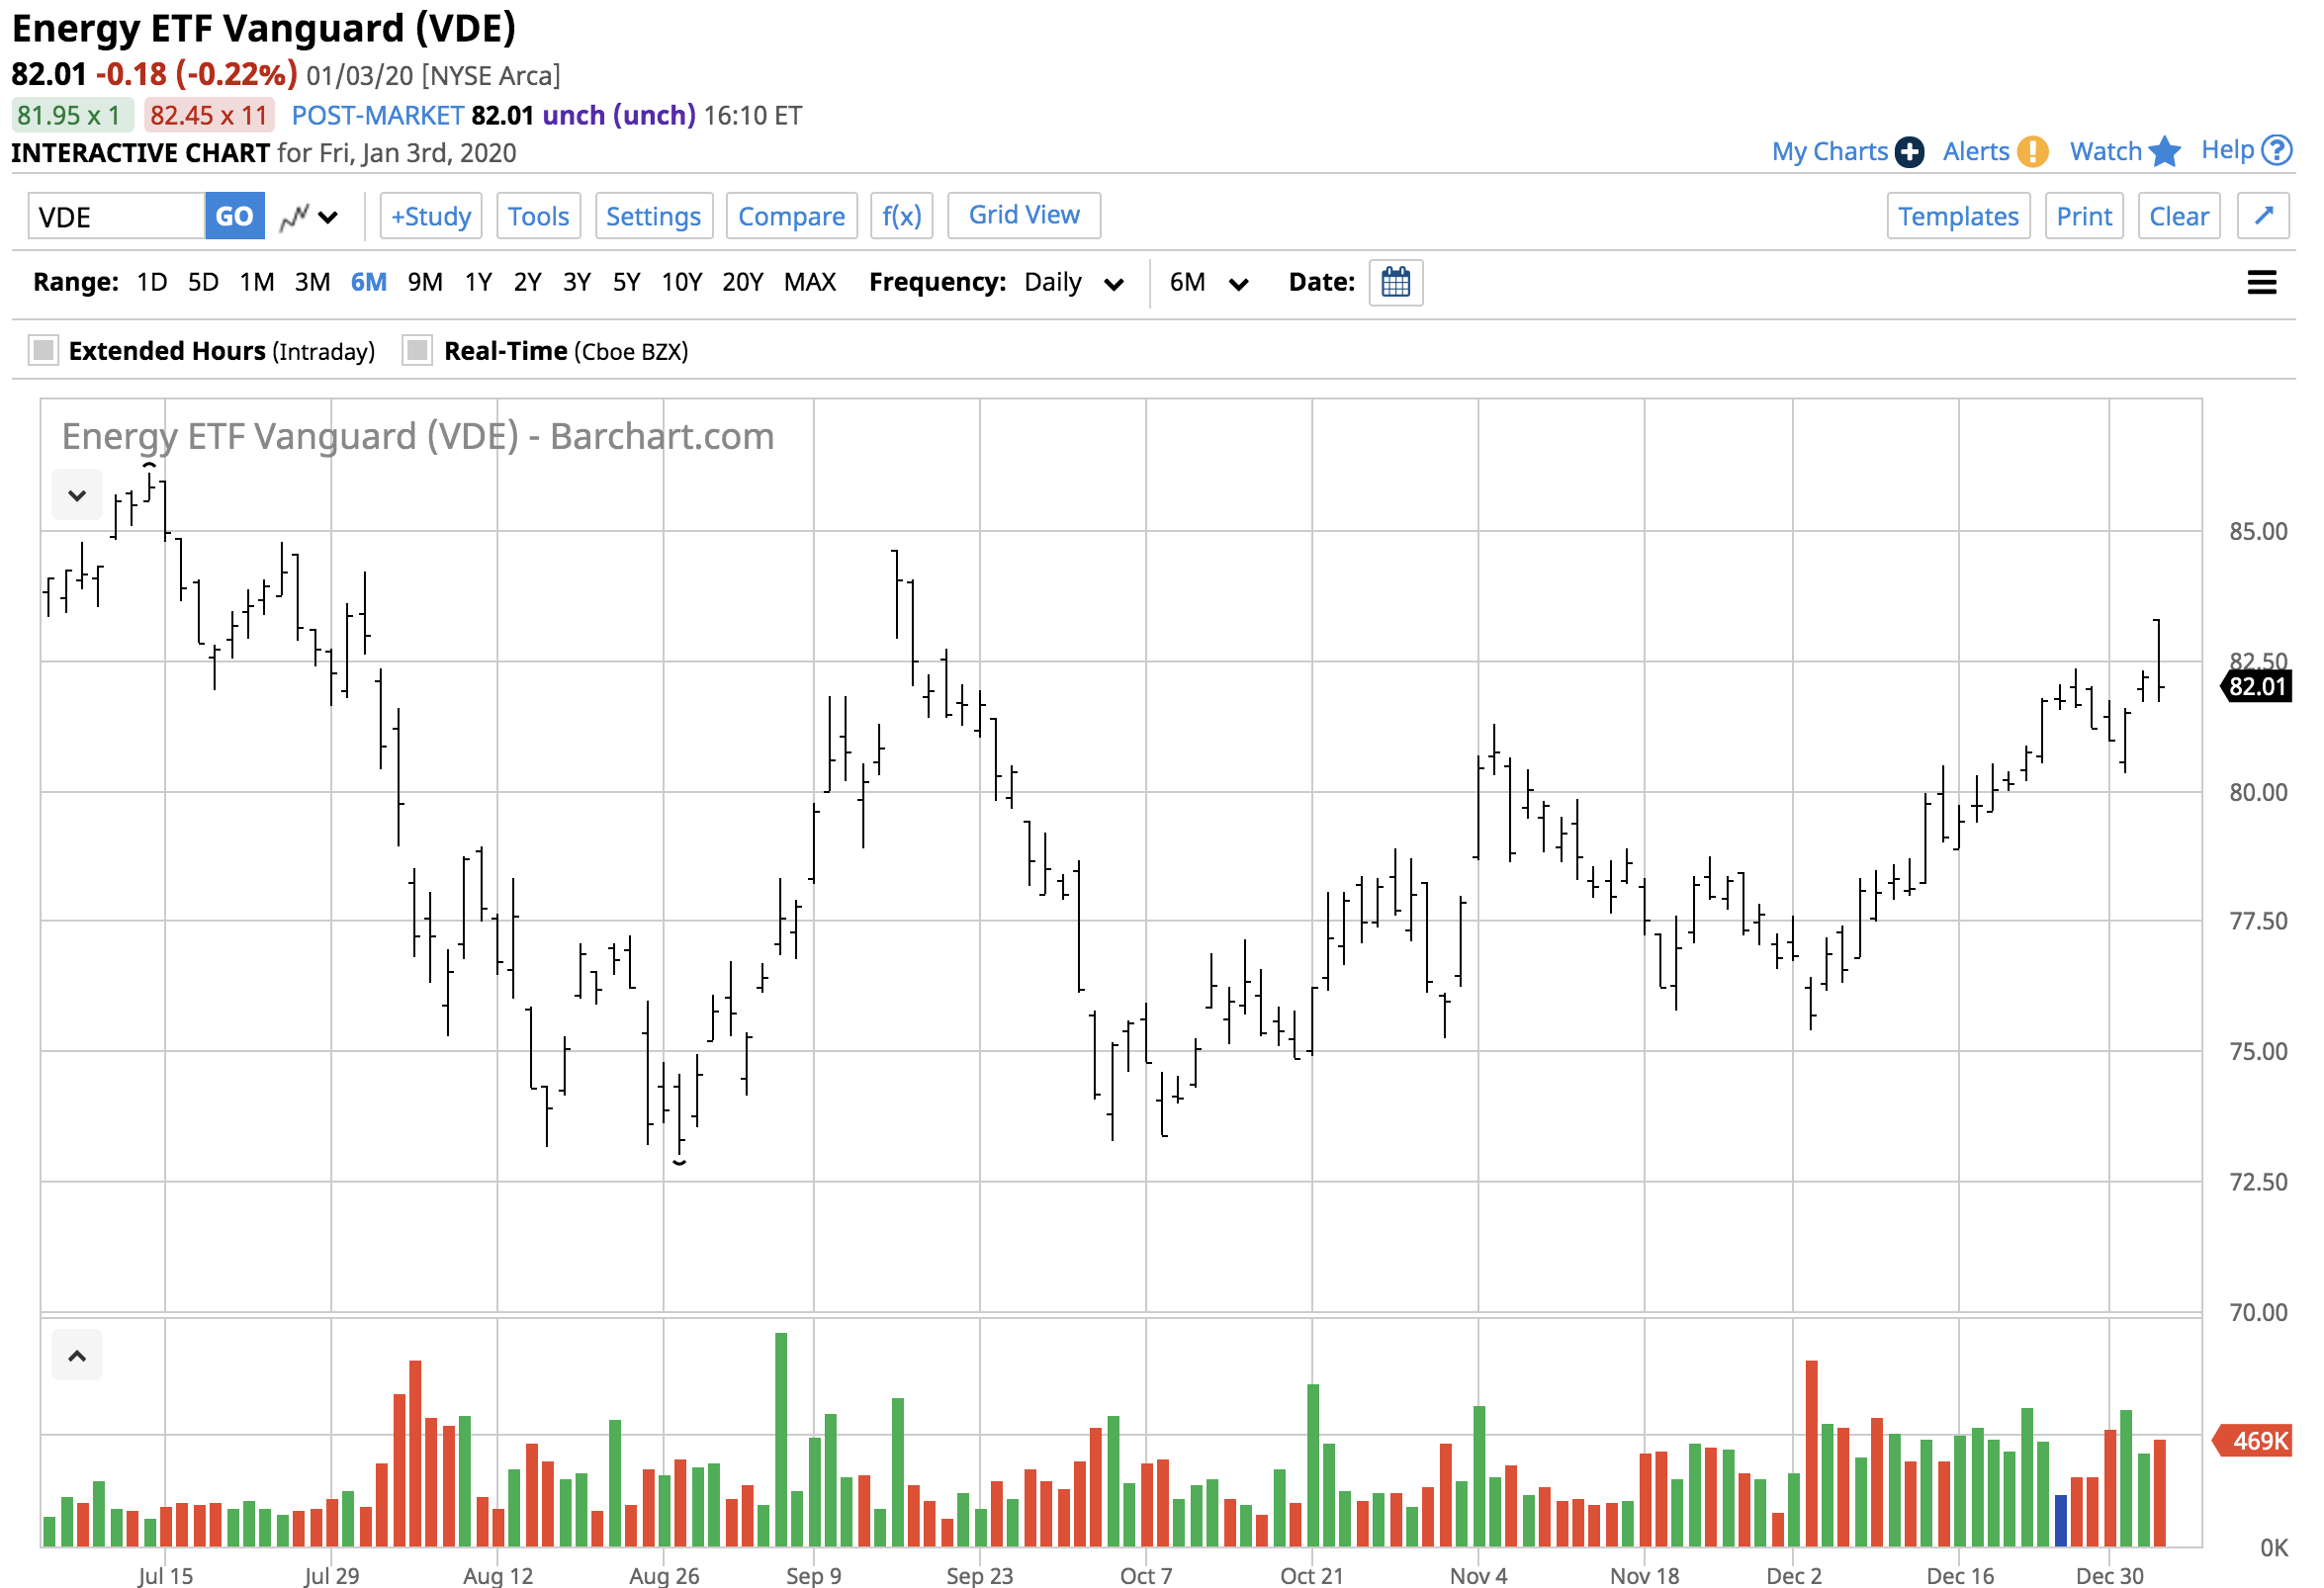 Source: Barchart
During Q4, it underperformed the energy commodity, as it appreciated by 4.45% compared to a rise in the price of NYMEX crude oil futures of 12.93%. VDE holds shares in many of the leading energy commodities in the world, including:
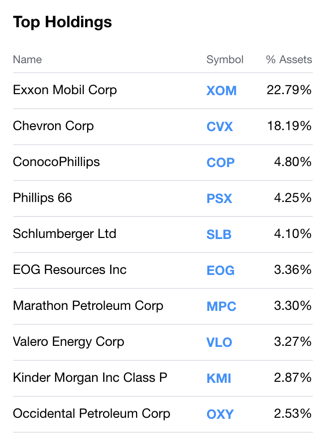
Source: Yahoo Finance
The VDE moved from $78.02 at the end of Q3 to $81.49 at the end of Q4.
Keep those stops tight and take profits when they are on the table in energy commodities, which are excellent trading markets for disciplined traders and investors who approach the markets with logical plans for risk and reward.
A more comprehensive review of the energy sector is available to subscribers to the Hecht Commodity Report.
Any investment involves substantial risks, including, but not limited to, pricing volatility, inadequate liquidity, and the potential complete loss of principal. This document does not in any way constitute an offer or solicitation of an offer to buy or sell any investment, security, or commodity discussed herein, or any security in any jurisdiction in which such an offer would be unlawful under the securities laws of such jurisdiction.
The Hecht Commodity Report is one of the most comprehensive commodities reports available today from the #2 ranked author in both commodities and precious metals. My weekly report covers the market movements of 20 different commodities and provides bullish, bearish and neutral calls; directional trading recommendations, and actionable ideas for traders. I just reworked the report to make it very actionable!
Disclosure: I/we have no positions in any stocks mentioned, and no plans to initiate any positions within the next 72 hours. I wrote this article myself, and it expresses my own opinions. I am not receiving compensation for it (other than from Seeking Alpha). I have no business relationship with any company whose stock is mentioned in this article.
Additional disclosure: The author always has positions in commodities markets in futures, options, ETF/ETN products, and commodity equities. These long and short positions tend to change on an intraday basis.