The data were stored on figshare6, a shared platform, that can be accessed publicly. Table 2 summarizes the test data set, which comprises a collection of 2 comma-separated value (CSV) files.
The data includes two laboratory tests conducted in both test platform A and B. The test data record the air temperature distribution of refrigeration container unit, CO2and O2 concentration level of refrigeration container unit, and temperature inside of vaccine package. The details of each test are described as following,
Test 1
The first test was conducted in test platform A (Fig. 1). The thermocouples have been installed inside of the refrigeration container unit to monitor the temperature distribution. The locations of these thermocouples are shown in the Fig. 3. 20 Styrofoam boxes (b1 to b20) were placed inside of the refrigeration container unit in two rows along both side walls while one more box (b0) was placed outside in the ambient for comparison purposes. The placement of the boxes can be seen in Fig. 4. The dry ice is delivered and filled in these 21 boxes (b0 to b20) with approximate 50 lbs dry ice going into each of them. A thermocouple is installed inside each of these 21 boxes (Fig. 5), however the locations of thermocouples inside these boxes are not same for all boxes, which will lead the different characteristics of boxes temperature profiles in test 1.
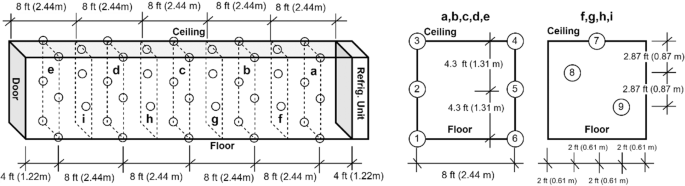
Location of thermocouples in refrigeration container in test platform A (Test 1).

Location of dry ice packages in refrigeration container in test platform A (Test 1).
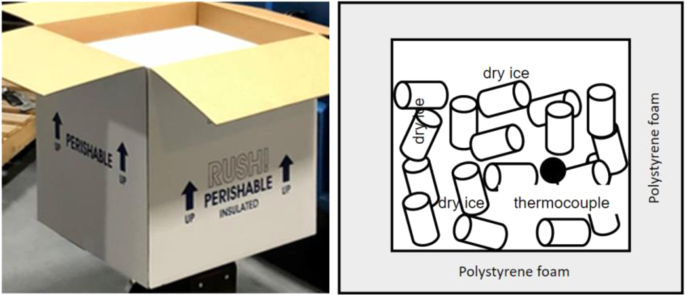
package with loaded dry ice (Test 1).
To evaluate the dry ice sublimation, one of the boxes (b11 in the Fig. 4) on the inside of the container was placed on a mechanical scale with a closed caption television camera pointed at the scale. This was also repeated on the outside with the box b0 that was in the ambient for comparison purposes.
A set of O2 and CO2 sensors was utilized by using a diaphragm pump located at the rear of the unit. It was hooked up using plastic tubing to pump the air from the inside of the refrigeration container to the sensor through a hole going through the drain holes of the refrigeration container.
To monitor the pressure differential from inside and outside the refrigeration container, an Omega 5 V differential pressure monitor was installed at the rear of the unit with tube going through the refrigeration units frame and stretching to the pressure monitor.
Test starts with unit reach the setpoint temperature −34.5 °C and 100% open fresh air vent (FAV), and all temperatures are recorded with 10 seconds of sample time. Although CO2 was kept low concentration level, but it is unable to maintain the setpoint. FAV was closed after approximating 24 hours. Approximate 100 hours after the test staring, FAV was opened for dissipation of CO2 while still trying to maintain setpoint inside the refrigeration container. FAV was left open for remainder of test. The mechanical scale reading of boxes (b11 and b0) are recorded through closed caption television camera at 3-hour intervals.
Test 2
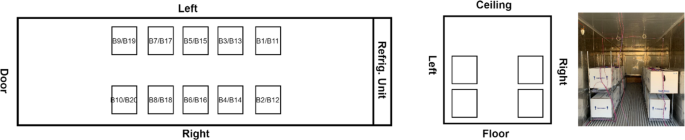
The second test was conducted in test platform B (Fig. 2). Thermocouples have been installed inside of refrigeration container unit to monitor the temperature distribution, as shown in Fig. 6. 20 Styrofoam boxes (B1 to B20) were placed inside of refrigeration container unit in two rows and two layers along both side walls while two boxes were placed inside of laboratory for comparison purposes. The placement of the boxes can be seen in Fig. 7. An empty small payload box was set inside of each package with dry ice surrounding it, as shown in Fig. 8. A thermocouple was placed in the centre of each payload box to represent the vaccine temperature.

Location of thermocouples in refrigerated container in test platform B (Test 2).
Location of thermocouples in refrigeration container in test platform A (Test 2).
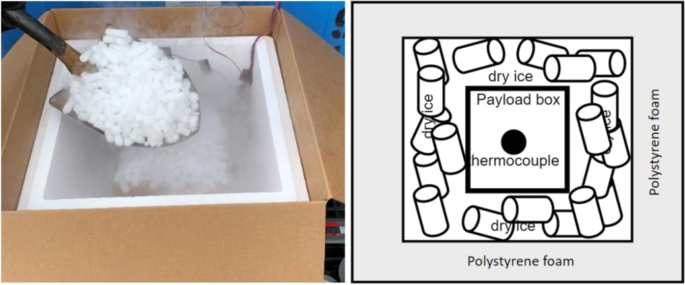
package with loaded dry ice and payload box insider (Test 2).
Similar to test 1, a set of O2 and CO2 sensors was utilized by using a diaphragm pump located at the rear of the unit. It was hooked up using plastic tubing to pump the air from the inside of the refrigeration container to the sensor through a hole going through the drain holes of the refrigeration container.
Test starts with unit reach the setpoint temperature −30 °C and closed FAV. FAV was left closed for entire test. All temperatures are recorded with 1 minute interval. Approximate 66 hours and 210 hours after the test staring, the back door of refrigeration container unit was open to investigate the changes of the CO2/O2 concentration levels inside refrigeration container unit during door-open period. The door was closed after the CO2/O2 concentration levels reaching safe values.
According to the test data, the temperatures of each payload box follow similar temperature profiles, a generic temperature profile of a vaccine payload box can be defined as shown in Fig. 9. The temperature profile can be divided into two regions: a temperature tolerable zone and a temperature non-tolerable zone. If the amount of dry ice left in the vaccine package can’t maintain the payload box temperature within the required temperature range of between −80 °C and −60 °C, it is in the temperature non-tolerable zone. Otherwise, it is in the temperature tolerable zone, which can be further divided into two stages: a stable period and an unstable period. In the stable period, the dry ice can keep the payload box at the dry-ice boiling point (sublimation point) temperature of −78.5 °C. When the payload box temperature starts to rise but is still within the required temperature range, it is in the unstable period of the temperature-tolerable zone.
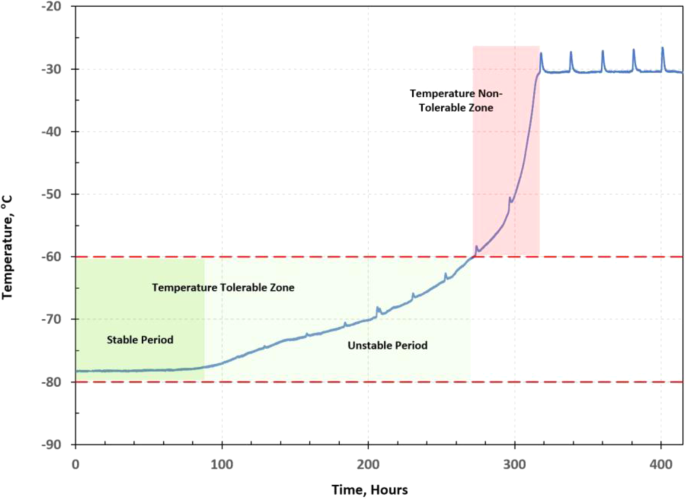
Generic temperature profile of vaccine payload box.