
nespix/iStock via Getty Images
Written by Nick Ackerman, co-produced by Stanford Chemist
One of the biggest questions in the closed-end fund space is how to tell if a distribution is being covered. It is a rather difficult question to answer with any certainty. One reason is that a fund can essentially pay whatever it likes, for however long the Board chooses to do so. To is to a certain degree, of course. They will still be limited to not paying out the entire net asset value of the fund. Typically, they would adjust if they are eroding away assets too quickly.
Some funds will also utilize managed distribution plans. That means, whether they are earning the distribution or not, they will target a specific percentage that resets periodically.
RiverNorth Opportunities Fund (RIV) and RiverNorth/DoubleLine Strategic Opportunity Fund (OPP) are examples of such funds. They both have 12.5% target distributions based on their net asset value per share. These are reset annually. I covered RIV and OPP previously if one is more interested in greater details on those funds. In those cases, the distributions will either raise or be reduced based on “the average of the Fund’s net asset value per share, as reported for the final five trading days.”
There is a straightforward way to tell if the fund is covering its distribution over time. You can simply watch the fund’s net asset value per share. If the NAV is rising, you then know that the fund is covering its distribution through capital gains or income at any given time. Generally, one would want to look back at least a year or more to get a good gauge of the longer-term coverage. Over shorter periods, there can be less certainty as the timing of underlying payouts comes into question.
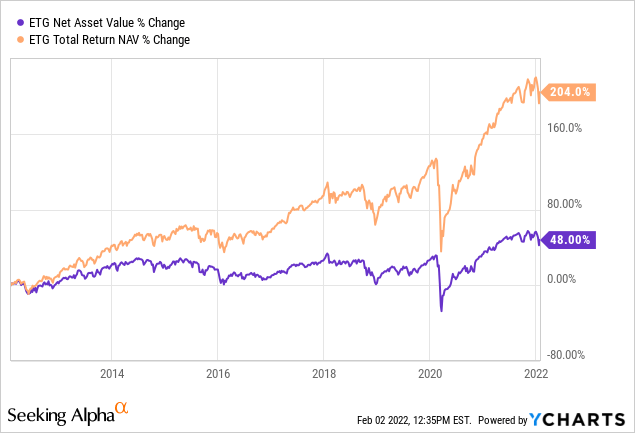
Additionally, another way that can be used to check is looking at the fund’s annualized returns. We can use the Eaton Vance Tax-Advantaged Global Dividend Income Fund (ETG) as a quick example. The fund’s current NAV distribution is 7.16% as of 2/2/2022. All the annualized NAV total return periods greater than a year show an amount above this. That would indicate that the fund has earned its distribution.
Below we can see that the NAV return below is 48% over the last 10 years as of February 2nd, 2022. I also included the total NAV return to help show how much of the fund’s distribution played a role in the returns for the fund. One thing that newer investors sometimes miss out on with CEFs is that they assume a flat or declining fund isn’t worth investing in. Some believe that since a fund is falling in price, investors have losses.
That just isn’t necessarily so; we have to factor in the distribution to see the value of a CEF. Sometimes the distribution is accounted for as 100% of the gain – meaning there has been no share appreciation.
Ycharts
Those are the quick metrics one needs to look at for covering a distribution historically. Here are some of the tips for when looking at a fund’s distribution sustainability going forward. Here, it will also come down to the type of assets the fund holds in its underlying portfolio. We will start with fixed-income funds as these are often easier to gauge.
Fixed-Income CEF Distribution Sustainability
Fixed-income CEFs are easier to analyze because they are more straightforward. An investor will primarily be looking at the coverage ratio of net investment income [NII]. NII is just simply what the fund is collecting in interest and dividends on the underlying portfolio. In the case of bond funds, this would be interest payments, and for preferred stock, this would be referring to dividends.
Different CEF sponsors report various reports at varying periods. For example, PIMCO gives investors a monthly update on UNII and coverage ratios. These can help determine if the fund is moving in the right direction.
Other fund sponsors give quarterly “earning” updates for their fixed-income funds, which I think is the most common frequency. Some only report during their required semi-annual and annual reports. These twice-a-year reportings are much more frequent with equity-based funds. Fixed-income sponsors seem to provide more frequent reports on their coverage. This could be because quarterly reports of NII aren’t necessarily useful for equities in the same manner for fixed-income-oriented funds.
Monthly reports are positive when a fund sponsor provides them. However, one must consider that not all interest or dividends are paid out monthly or quarterly. This means that there may be ‘ups and downs’ that one must consider from month to month. In some cases, this is where a quarterly report can be more ideal as we can get a smoothed-out reporting. Some of the reports provide rolling and YTD coverage, which can help.
PIMCO is one of those fund sponsors that provide these more frequent monthly updates. We are looking at data as of December 31st, 2021. The January 31st, 2022 update is available on their website.

PIMCO UNII Report (PIMCO)
Here we can see coverage across the board has been strong. Earlier in 2021, they cut distributions for a few of their funds. Those that cut included; PIMCO Corporate & Income Opportunity Fund (PTY), PIMCO Income Strategy (PFL) and PIMCO Income Strategy Fund II (PFN).
These are some of their more popular funds, but it appears that those cuts have helped firm up their coverage now. This was opposed to when they last reported their fiscal year-end. At that time, all three of these funds had shown quite a gap in NII from what they were paying out.
The latest UNII report shows us that coverage is looking healthier in these funds. However, what also needs to be weighed is the current environment. One of the big talks right now is interest rate increases from the Fed. Since these funds are heavily leveraged, their interest expenses could rise. They aren’t the only leveraged funds; most CEFs are leveraged to some degree.
That being said, it is likely to put short-term pressure on coverage as expenses will rise faster than their portfolio will turnover. That’s why a focus lately has been on shorter-duration funds. Those are funds that should be able to take advantage of higher rates first. Over the medium to longer term, higher rates are better in terms of distribution coverage from funds. So it’ll be something to monitor much more closely while rates remain the center of the discussion.
Equity CEF Distribution Sustainability
For equity CEFs, it is a bit more unpredictable. This is largely due to the fact that the funds will rely on capital gains to fund their distributions. In some cases, the distributions will be covered only from capital gains.
That presents a big problem that I noticed with newer CEF investors or those not focused on equity-based CEFs. They will look at an aggregator site like CEFConnect or CEFData and see the underlying fund’s “earnings” and notice that they don’t appear to be covering a fund’s distribution.
The earnings that they refer to are merely what the fund is covering through interest and dividends that a fund is taking in. In other words, the only factor here is NII. This leads to quite a few investors writing these funds off, which can be solid funds with potential.
This isn’t to be derogatory towards these sites. I use them very frequently, as most readers will notice. However, it can be confusing for newer investors. It isn’t to say that NII isn’t necessary, though. It still plays a role. It just doesn’t factor in capital gains that the funds can pull in.
More specifically, looking at the fund’s “built-in” unrealized appreciated capital can be very helpful in comparing funds. Of course, this isn’t as straightforward as it seems either. This is because many sectors are involved in equity investing. These various sectors can be in a downtrend or uptrend relative to the broader market.
Of course, what makes it so challenging to predict capital gains or unrealized gains is it will depend on many factors. It comes down to how the broader market will perform. How the sector will perform if it is a sector-specific fund. And how well the managers can maneuver their fund through different periods too. Unrealized gains will come and go along with how the fund’s underlying portfolio will perform.
We will go back to ETG once again. They posted their last Annual Report somewhat recently. On page 18 in that report, you come to the “Statements of Changes in Net Assets” table. This handy table shows us the “earnings” from the previous two years.

ETG Annual Report (Eaton Vance)
The first line here gives us our NII for the fund. That is followed by realized gains – meaning the positions they sold that had gains relative to losses. In this case, it was a huge positive at nearly $187 million. After that, we have the unrealized appreciation/depreciation of the portfolio listed. That’s what the underlying positions in the portfolio gained or lost during this period. In this case, we see massive gains once again. This is consistent with the fact that we were in full-on bull market mode during the reporting period.
From there, we can see that the net increase of assets is below that factoring in these three lines. Finally, we see what the fund paid out in terms of distributions for that period. Since the fund reported NII of ~$63 million for the period, we would put that against the ~$100 million paid out. That provides us with some pretty simple math; we’d say that the NII coverage of the fund is 63%.
NOTE: ETG generally carries a high amount of NII relative to other equity funds; coverage can often be significantly lower regarding NII coverage.
We know that isn’t enough to fund the distribution. Yet, they boosted their distribution earlier in the year anyway. This is because of all the capital gains the fund was realizing. To avoid the excise tax, a regulated investment company is required to pay out the majority of its earnings, whether it be income or gains.
We already noted that the fund was covering its distribution at the opening. This now gives us the figures on what was going on in the underlying portfolio over the fiscal year. We would also have to factor in the fund’s new distribution too. Based on the new payout and shares outstanding, the fund would need around $119 million in the next 12 months.
One factor to consider for equity funds is the exact distribution level on a NAV basis. For ETG, the rate comes to 7.16%. We just have to simply ask ourselves if we believe this is a sustainable level. We know the S&P 500’s long-term average market returns were around 10.5%. So a plain equity fund should be able to deliver around there if it is invested similarly to the S&P 500.
ETG is a globally positioned fund, and based on setting more realistic expectations more broadly, I always consider 8% the sweet spot. Below that, an equity fund should grow its NAV and fund its distribution. At 10%+ distributions, I would take caution at the payout’s sustainability.
Conclusion
To summarize, the easiest way to tell if a fund is earning its distribution is by watching the funds NAV. If it is rising or staying flat, it would be considered covered. Another way to measure it quickly is to look at the annualized returns. If the total NAV returns are higher than the fund’s current distribution, it should be covering the distribution or close to being able to cover it.
For fixed-income funds, looking at the NII of the fund is the key to sustainability. However, interest rate changes should also be considered too for coverage going forward. For equity funds, it becomes more complicated as it relies more on the unpredictability of the market overall. In that case, capital gains will often be a large contributor the sustainability – if not entirely. Therefore, current market conditions and expectations should be factored in here. Generally, I look at the NAV distribution rate to gauge if it seems sustainable or not at current levels.