
Study selection
Our literature search yielded 458 records: 154 were identified through PubMed-Medline, 173 from the Scopus databases, 32 via EBSCOhost and 99 through the AJOL platforms. No additional publications on the association between PBDs and CVD risk in Africa, apart from this systematic review’s protocol [35] was identified via the Conference Proceedings Citation Index (CPCI). Six duplicates were identified prior to screening the TIABs. During the TIABs screening we identified two articles that reported findings from the same study cohort, and the most comprehensive publication was selected. Four hundred and twelve studies were excluded based on the reasons summarized in Fig. 1. After full text assessment, fifteen studies met the inclusion criteria. Nine of the eligible studies were retrieved from PubMed-Medline [39,40,41,42,43,44,45,46,47,48,49,50], and three from the EBSCOhost platform [51,52,53]. No additional studies were identified after manually screening the reference lists of the included studies.
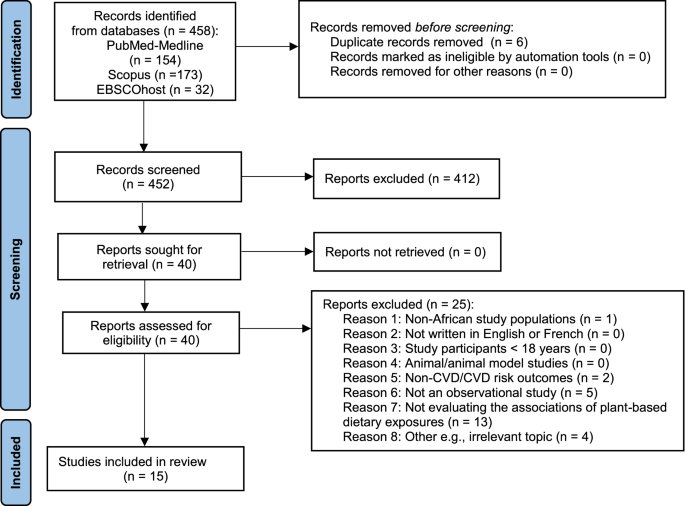
PRISMA Flow diagram of the study selection
Study characteristics
Included studies originated from 12 countries across SSA: (n = 1) Kenya [44], (n = 1) Botswana [52], (n = 1) Zambia [42], (n = 1) Ghana [48], (n = 1) Democratic Republic of the Congo (DRC) [50], (n = 1) Ethiopia [53], (n = 3) Tanzania [43, 45, 47], and (n = 7) South Africa [39,40,41, 46, 47, 49, 51]. One study [47] had four recruitment sites namely Nigeria, Tanzania, South Africa, and Uganda. In addition to this, five African countries namely Mozambique, Nigeria, South Africa, Sudan, and Uganda participated in a multi-country study [39]. According to the World Bank data [54], 2 of the 12 SSA countries are classified as upper middle income [40, 41, 46, 49, 51, 52], 6 are low-to-middle income [42,43,44,45, 47, 48, 50], and 4 are low-income countries [39, 47, 53]. The included studies (n = 15) were published from the year 2002 to 2020. There was low heterogeneity across studies in terms of study design: 13 were cross-sectional [40,41,42,43,44,45,46,47,48, 50,51,52,53], 1 cohort [49] and 1 case-control [39]. Eighty-seven percent of the included studies had a cross-sectional study design with comparable health outcomes (e.g., 7 of the 15 studies assessed overweight/obesity). However, the included studies reported on different dietary exposures, association measures, and were conducted in study populations with different characteristics (Tables 1 and 2) that could not be pooled to conduct meta-analyses. Therefore, we provide a narrative summary of their findings. The total number of participants across included studies was 11,088, and per study, the number of participants ranged from 110 to 2362. All participants were adults 18 years or older, and the proportion of men ranged from 0 to 52%. Two of the studies did not provide clear estimates for the age of their participants and three studies did not assess a dietary comparator; therefore, we did not extract data for these variables (Tables 1 and 2).
Plant-based dietary exposures identified in the African setting
Across the fifteen studies, the following plant-based dietary exposures were identified (see Additional file 4: Table S3): the consumption of plant foods, indicator food categories, adhering to a healthy dietary index and plant-based dietary or nutrient patterns.
Consumption of plant foods
Eight of the included studies reported on the consumption of healthy plant foods. Fruits and vegetables were the most frequently reported plant foods [40, 42, 44, 46, 51, 53]. In addition to assessing the consumption of fruits and vegetables, we regarded the consumption of salads as a healthy plant food [51]. Other included studies assessed the usual consumption of vegetables with a high antioxidant content: leafy vegetables such as Cassava leaves (Manihot esculanta) and Bitetkuteku (Amaranthus Hybridus), and fruit vegetables and legumes namely Solo (Solanum aethiopicum) and dried red beans (Phaseolus vulgaris) [50], as well as green vegetables and coconut milk [45].
Indicator food categories
One study reported on the assessment of six indicator food categories of which 3 met the criteria of our dietary exposure; the categories comprised of healthy plant foods such as fruits, vegetables, and legumes. These indicator food categories were identified using a food frequency questionnaire [41].
Dietary index
A multi-country case-control study that included five African countries, applied the modified Alternative Healthy Eating Index (mAHEI) as a measure of dietary quality and investigated its relation to the incidence of stroke. The mAHEI includes the primary components of a PBD such as fruits, vegetables, wholes, nuts, and legumes [39].
Plant-based dietary and nutrient patterns
Thirty-three percent of the studies reported on dietary patterns with higher factor loadings of plant versus animal foods. We classified these five studies as having plant-based dietary exposure patterns. Galbete et al., reported on the “Roots, tubers and plantain” dietary pattern, which was identified in their rural Ghanaian participants using principal component analysis (PCA) [48]. The PCA method was also applied by Holmes and colleagues who identified a “Mixed” dietary pattern, which differed slightly by sex. Three plant-based dietary patterns were identified in women from urban and rural areas in Botswana. Motswagole et al., labelled them as the: “Fruit and vegetable”, “Fish and nuts” and “Botswana traditional foods” dietary patterns [52]. Another study identified the “Healthy” and “Complex carbohydrate” dietary patterns that had high factor loadings for fruits, vegetables as well as legumes, roots, and tubers [43]. One study identified four plant driven nutrient patterns namely the “Magnesium, Phosphorus and Plant protein” and “Starch, Dietary Fibre and Vitamin B” driven patterns that was identified in rural Black South African women, and the “Thiamine, Starch and Folate” driven pattern in urban women. In addition to, the “Thiamine, Zinc and Plant Protein” pattern that was identified in their male counterparts [49].
CVD risk outcomes and measures of association
All included studies reported on CVD/CVD risk profile as a health outcome: acute stroke (n = 1), dyslipidaemia (n = 1), MetS (n = 1), hypertension (n = 3), T2D (n = 3), and overweight/obesity (n = 7) and assessed its relation to plant-based dietary exposures. Most of the studies reported their effect estimate using ORs [42, 47, 48, 50, 53], and others reported the ARRs [43], relative risk (RR) [52] and population attributable risk (PAR) [39]. Katalambula et al., was the only study to present their data using ARRs [43]. Therefore, based on common statistical terminology and for the purpose of interpreting their results we assumed that it represents the absolute risk reduction (ARR) [55]. The association measures were presented with precision i.e., 95% confidence intervals (95% CIs), however, O’Donnell et al. was the only study that provided a narrower interval with 99% confidence [39]. Almost a third of the studies reported their data as prevalence estimates using count and percentage proportions [39, 40, 46, 47]. Three studies reported means with [51] or without standard deviations [44] and/or medians with the interquartile ranges [41]. Even fewer studies (n = 2) reported β regression coefficients with 95% CIs [45, 49]. A summary of the abovementioned reported effect estimates was recorded (see Additional file 4: Table S3).
Association between plant-based dietary exposures and CVD risk profile in SSA
None of the included studies in this review stated that they assessed a PBD per se; however, they either assessed specific plant foods, food groups and/or dietary and nutrient patterns that were consistent with our dietary exposure of interest. Our results are therefore, presented according to the assessment of plant-based dietary exposures and their potential benefits to protect African populations against CVD. Nine studies had significant associations between the plant-based dietary exposures and CVD risk factors, this is outlined in Table S3 as part of the supplementary material (see Additional file 4). However, there was no significant association between hard CVD and the plant-based dietary exposure. In addition to this, no studies reported data on factors, which may alter the associations that were found between the plant-based dietary exposures and CVD risk profile across African populations. Below we have outlined the results and analyses performed by the studies that reported significant findings.
Plant-based dietary exposures and type 2 diabetes (T2D)
The RODAM study investigated different dietary patterns among Ghanaian adults in relation with T2D risk. Only after conducting sensitivity analyses that excluded individuals with self-reported diabetes, did the authors find an inverse association (p = 0.016) with their plant-based dietary exposure. Rural Ghanaians had the highest adherence to the “roots, tubers and plantain” dietary pattern that was inversely associated with T2D, as presented for the highest tertile in adjusted model 3, the OR was 0.98 (95% CI:0.71–1.35) [48]. In South Africa, Chikowore et al. investigated which dietary factors are associated with predictive biomarkers of T2D. Two of the plant driven nutrient patterns that they identified: “Starch, dietary fibre and B vitamins” and the “Thiamine, zinc and plant protein” patterns, had significant inverse associations with the glycaemic markers in their rural participants. In men, the latter nutrient pattern inversely associated with low glycated haemoglobin (HbA1c) levels [β = − 0.288 (95% CI: − 0.543; − 0.033)], and fasting blood glucose levels [β = − 0.382 (95% CI: − 0.752; − 0.012)]. In rural women, who followed the “Starch, dietary fibre and B vitamins” driven nutrient pattern; the fasting glucose [β = − 0.236 (95% CI: − 0.458; − 0.014)] and HbA1c levels [β = − 0.175 (95% CI: − 0.303; − 0.047)] were significantly lower in the fully adjusted regression model [49].
Plant-based dietary exposures and hypertension
Three studies found inverse associations between hypertension, and either the consumption of plant foods or a plant-based dietary pattern. Rush et al., reported significant rural vs. urban differences in the dietary intake of fruits amongst adults from Zambia (48.5% vs. 17.1%, p < 0.001). They found that eating more vegetables during the week was inversely associated with hypertension in rural Zambians, with an adjusted OR of 0.76 (95% CI:0.45–0.94) [42]. In Tanzania, Katalambula and colleagues conducted a study in residents of Arusha and showed that 42% of their participants consumed a ‘Healthy’ dietary pattern and were less likely to have hypertension. There was a significant negative association between the ‘Healthy’ dietary pattern and being hypertensive, the ARR was reported to be 0.82 (95% CI:0.68–0.99) [43]. The dietary practices of hypertensive patients from Kenya were assessed in relation to other risk factors. We observed that the authors of this study by Kimani et al., only reported crude association estimates (i.e., mean values) for their plant-based dietary exposures. In the latter study, the consumption of vegetables was significantly associated with a lower mean systolic blood pressure (SBP), for daily vs. frequently vs. rarely consuming vegetables and (p-values): 138.36 mmHg vs. 142.49 mmHg vs. 153.25 mmHg (0.032), lower diastolic blood pressure (DBP) 87.83 mmHg vs. 92.87 mmHg vs. 98.38 mmHg (p = 0.024), and lower body mass index (BMI) 28.55 kg/m2 vs. 29.85 kg/m2 vs. 34.36 kg/m2 (p = 0.006). The consumption of fruits daily, frequently and rarely was respectively associated with a lower mean BMI of 27.99 kg/m2, 29.68 kg/m2 and 29.79 kg/m2 (p = 0.011), and lower mean total cholesterol (TC) of 5.31 mmol/L, 5.71 mmol/L and 5.49 mmol/L (p = 0.033). The authors only conducted regression analysis for other risk factors i.e., BMI and alcohol intake, and did not report any adjusted association measures (i.e., ORs) for their dietary practices. As mentioned above, their dietary practices namely fruit and vegetable consumption appear to be inversely associated with hypertension based on the crude estimates [44].
Plant-based dietary exposures and overweight/obesity
Three of the included studies reported significant negative associations between the consumption of plant foods and plant-based dietary patterns with overweight/obesity [40, 45, 51]. In the Eastern Cape province of South Africa, Otang-Mbeng and colleagues found that regularly eating vegetables was negatively associated with obesity (p < 0.05). However, the latter study did not perform regression analysis to determine whether adjusting for confounders such as older age and female sex, would affect the inverse association between vegetable consumption and obesity. Of note, this study had a quality score of 5 out of 14, which reflects poorly on its methodology [35]. In Tanzania, a study examined the association between obesity and the consumption of green vegetables and coconut milk among residents from three areas. Positive correlations were found between the consumption of coconut milk and BMI (p < 0.001), which was seen in both sexes. In addition to this, BMI status also correlated positively with the consumption of green vegetables (p < 0.001). Subsequently, when adjusting for confounders such as age in the multivariable regression analysis, it revealed that the positive association between the BMI status and coconut milk consumption only remained significant in males (p = 0.003) [45]. Motswagole et al., conducted a study in Botswana that identified six dietary patterns that were prevalent in females, and we regarded three of these patterns as being plant-based (Table 2). In their study there was a positive association between a high intake of the vegetable and fruit pattern and the risk of central obesity, RR of 1.43 (95% CI:1.18–1.72). Likewise, strong positive associations were seen in females with a higher adherence to the Botswana traditional food pattern and the risk of general (RR = 1.60, 95% CI:1.21–2.10) and central obesity (RR = 1.35, 95% CI:1.12–1.64). These positive associations were only maintained in individuals that were ranked as being highly adherent to the Botswana traditional food pattern (i.e., tertile 3); in spite of the further adjustments in their multivariate model that accounted for total energy intake [52].
Plant-based dietary exposures and dyslipidaemia
Njelekela and colleagues also investigated the association between dyslipidaemia and dietary factors. They found a negative correlation between green vegetables consumption and TC in both males and females. However, these findings did not remained significant in their multivariable regression analyses that adjusted for age and BMI [45].
Plant-based dietary exposures and metabolic syndrome (MetS)
One study investigated the association between antioxidant rich vegetables and a combination of CVD risk factors to determine the risk of MetS. This study was conducted among T2D patients in the DRC and its dietary focus was the regular consumption of vegetables rich in antioxidants. Only 13% of the study participants never consumed vegetables that are rich in antioxidants, and none of the T2D patients reported that they ate fruits. This study population mostly consumed Cassava leaves (39%), and dried red beans (26%) as their source of antioxidants, which were the only plant-based dietary exposures that was inversely associated with MetS after adjusting for confounders in their regression analysis. The consumption of Cassava leaves was found to have an independent protective effect on the risk of having MetS with an OR of 0.40 (95% CI:0.20–0.90). Similar inverse associations were reported in those consuming dried red beans, which was also protective against MetS with an OR of 0.40 (95% CI:0.20–0.80) [50].
Quality assessment of the included studies
The quality of the 15 studies was assessed using the NHLBI tool for observational studies, the supplementary material shows the quality scores for each of the included studies (see Additional file 4: Table S2). The NHLBI quality assessment tool for cross-sectional and cohort studies consists of 14 questions, which were used to critically assess the methodology of 14 of the included studies. Only one study [39] was assessed using the NHLBI quality assessment tool for case-control studies that considered 12 criteria to rate the methodological quality. Fourteen studies were rated as having fair methodological quality, and one study [40] received a poor-quality rating. Two of the eligible studies [40, 41] did not meet at least 50% of the quality criteria as stipulated in the NHBLI tool for cross-sectional studies. Moreover, the majority of the included studies report cross-sectional findings that are prone to several biases and confounders [37]. Cross-sectional studies [56] are based on observations at a single timepoint, with insufficient power if the sample size is reasonably small [40, 51], which presents a poorer level of evidence [57]. Additionally, we cannot determine whether e.g., the identified plant-based dietary exposures are the cause or effect of the reduction in CVD risk factors, and vice versa. Causal relationships can only be deduced from longitudinal cohort observational and randomized intervention studies or case-control observational studies, where the effect/outcome is known [56].
We did not exclude any of the eligible studies based on quality, however, we have interpreted the results whilst considering its limitations. We identified minor instances of implausible reporting of study findings. In terms of the study characteristics specifically the demographics; two of the studies [44, 46] presented the age of their participants in a manner that was not easy to interpret. Kimani et al., reported age as a categorial variable by comparing three age groups, however, reporting the mean age would have given the readers an indication as to whether or not the age variable was normally distributed [44]. Masilela and others followed the same approach by only reporting the age of their participants categorically (Table 1). Although these are minor reporting biases, age is a well-known confounder when assessing associations, and should therefore be reported as clearly as possible. Masilela et al., appropriately adjusted for age during their logistic regression analysis [46]. However, Kimani and colleagues did not state whether they adjusted for age in their regression models and did not include all the relevant predictors. In the paper by Kimani et al., they did not state why they did not perform logistic regression analysis for their plant-based dietary exposures i.e., daily consumption of fruits and vegetables, which was statistically significant in their analysis of variance (ANOVA) tables [44].