Today we’ll evaluate The Warehouse Group Limited (NZSE:WHS) to determine whether it could have potential as an investment idea. To be precise, we’ll consider its Return On Capital Employed (ROCE), as that will inform our view of the quality of the business.
First of all, we’ll work out how to calculate ROCE. Then we’ll compare its ROCE to similar companies. Then we’ll determine how its current liabilities are affecting its ROCE.
Return On Capital Employed (ROCE): What is it?
ROCE is a metric for evaluating how much pre-tax income (in percentage terms) a company earns on the capital invested in its business. Generally speaking a higher ROCE is better. Ultimately, it is a useful but imperfect metric. Renowned investment researcher Michael Mauboussin that a high ROCE can indicate that ‘one dollar invested in the company generates value of more than one dollar’.
So, How Do We Calculate ROCE?
The formula for calculating the return on capital employed is:
Return on Capital Employed = Earnings Before Interest and Tax (EBIT) ÷ (Total Assets – Current Liabilities)
Or for Warehouse Group:
0.22 = NZ$114m ÷ (NZ$1.1b – NZ$540m) (Based on the trailing twelve months to July 2019.)
Therefore, Warehouse Group has an ROCE of 22%.
See our latest analysis for Warehouse Group
Does Warehouse Group Have A Good ROCE?
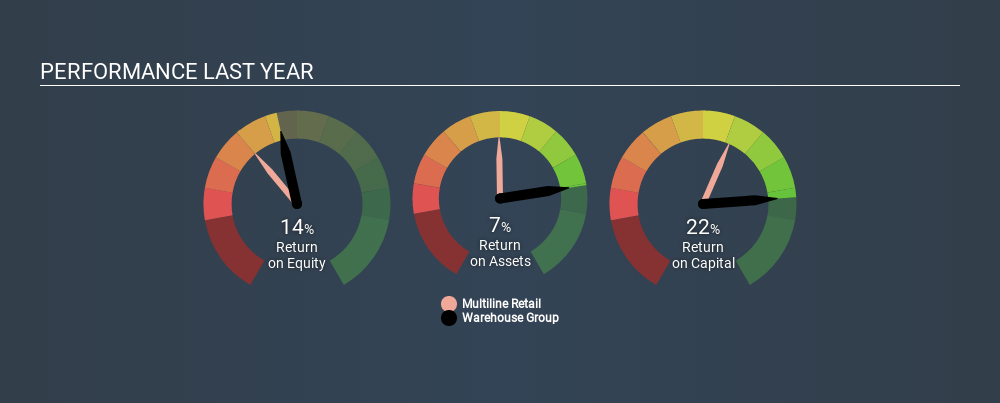
When making comparisons between similar businesses, investors may find ROCE useful. Using our data, we find that Warehouse Group’s ROCE is meaningfully better than the 7.8% average in the Multiline Retail industry. We would consider this a positive, as it suggests it is using capital more effectively than other similar companies. Putting aside its position relative to its industry for now, in absolute terms, Warehouse Group’s ROCE is currently very good.
We can see that, Warehouse Group currently has an ROCE of 22% compared to its ROCE 3 years ago, which was 15%. This makes us think the business might be improving. You can see in the image below how Warehouse Group’s ROCE compares to its industry. Click to see more on past growth.
When considering this metric, keep in mind that it is backwards looking, and not necessarily predictive. ROCE can be misleading for companies in cyclical industries, with returns looking impressive during the boom times, but very weak during the busts. This is because ROCE only looks at one year, instead of considering returns across a whole cycle. Since the future is so important for investors, you should check out our free report on analyst forecasts for Warehouse Group.
How Warehouse Group’s Current Liabilities Impact Its ROCE
Liabilities, such as supplier bills and bank overdrafts, are referred to as current liabilities if they need to be paid within 12 months. Due to the way ROCE is calculated, a high level of current liabilities makes a company look as though it has less capital employed, and thus can (sometimes unfairly) boost the ROCE. To check the impact of this, we calculate if a company has high current liabilities relative to its total assets.
Warehouse Group has total assets of NZ$1.1b and current liabilities of NZ$540m. Therefore its current liabilities are equivalent to approximately 51% of its total assets. Warehouse Group boasts an attractive ROCE, even after considering the boost from high current liabilities.
The Bottom Line On Warehouse Group’s ROCE
So to us, the company is potentially worth investigating further. There might be better investments than Warehouse Group out there, but you will have to work hard to find them . These promising businesses with rapidly growing earnings might be right up your alley.
If you are like me, then you will not want to miss this free list of growing companies that insiders are buying.
If you spot an error that warrants correction, please contact the editor at [email protected]. This article by Simply Wall St is general in nature. It does not constitute a recommendation to buy or sell any stock, and does not take account of your objectives, or your financial situation. Simply Wall St has no position in the stocks mentioned.
We aim to bring you long-term focused research analysis driven by fundamental data. Note that our analysis may not factor in the latest price-sensitive company announcements or qualitative material. Thank you for reading.
Discounted cash flow calculation for every stock
Simply Wall St does a detailed discounted cash flow calculation every 6 hours for every stock on the market, so if you want to find the intrinsic value of any company just search here. It’s FREE.