Enrichment factor (EF)
The EF13 is calculated by relating the metal (M) concentration in samples with that of Earth’s crust12. In this study, Fe is considered as a reference13 and EF is calculated by using the following equation:
$${text{EF}} = ({text{M}}/{text{Fe}})_{{{text{sample}}}} /left( {{text{M}}/{text{Fe}}} right)_{{{text{crust}}}}$$
(1)
The EF is used to discriminate between natural versus anthropogenic sources. The EF value close to 1 generally indicates a geogenic source for HMs and an EF value > 1.5 suggests an anthropogenic contribution from non-crustal materials14. EF analysis cannot exactly assess the degree of contamination in the natural environment, it broadly classifies the geogenic or anthropogenic sources of the pollutants and the role of human activities, climate, weathering, erosion, and other sedimentary processes involved in the distribution of the metals15. Geochemical surveys indicate that the EF of metals in soils is influenced by various natural and anthropogenic processes and contamination is one of the factors15. EF of HMʹs calculated showed low to high enrichment for As (0.18–25.47) and Cr (1.02–21.78), low to moderate enrichment for Ni (1.09–7.09) and Pb (0.18–4.74), and low enrichment similar to crust for Cu (0.49–3.16), Zn (0.24–2.43), Hg (0.15–1.84) suggesting As, Cr and Ni as the major pollutants of concern in the study area. Spatial distribution mapping of EF (Fig. 5) showed significant to very high EF values for As in the north-eastern, northern, and western parts of the study area overlapping with the area under agriculture practices of sugarcane, rice, and mango farming. Excessive application of pesticides and fertilizers for higher crop yield and disease protection and extensive groundwater pumping for irrigation would have resulted in As enrichment. The EF of As shows no overlap with the local geology, indicating the anthropogenic sources of As contamination. On the other hand, significant to very high EF values for Cr in the northern, central, and western parts of the study area overlap with the area covered by granite gneiss rocks. Further, EF of Cr values does not overlap with the agricultural field area, indicating geogenic sources for Cr contamination (granite gneiss). Arsenic and Cr exhibited a weak correlation with each other (0.04, Fig. 7b) confirming different sources of these toxic metals, most probably pesticides, fertilizers, and groundwater irrigation for As and local granite gneissic rocks for Cr.
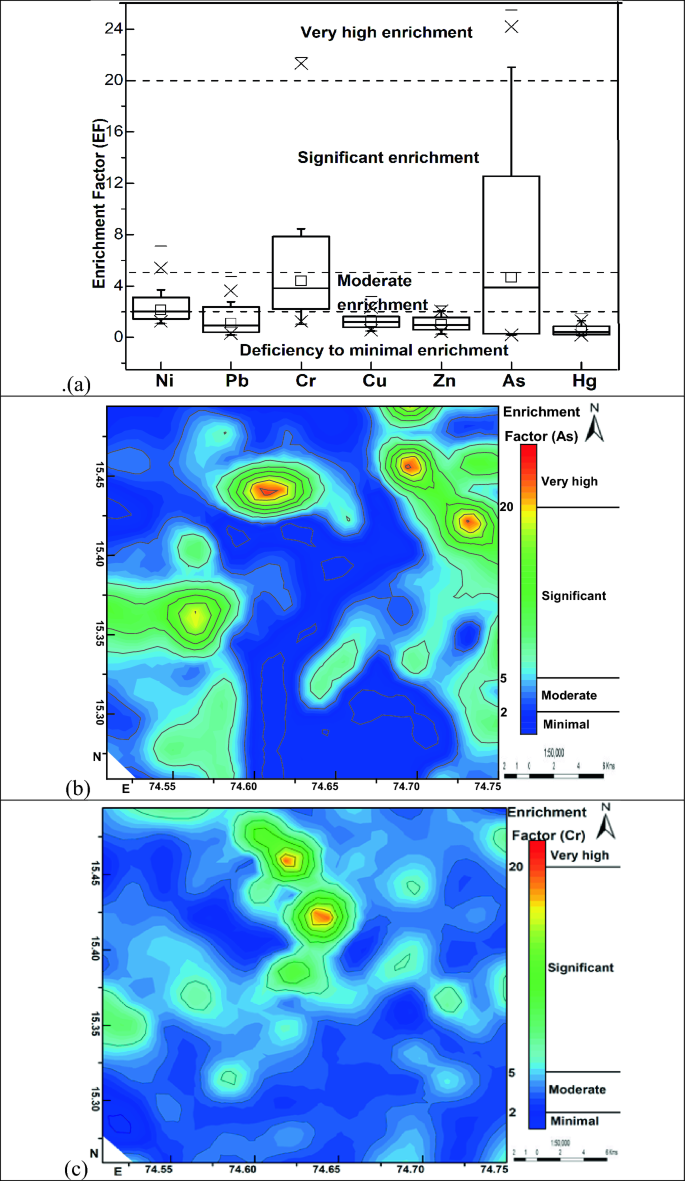
(a) Enrichment factor of selected heavy metals, the spatial distribution of enrichment factors for (b) As and (c) Cr in the surface sediment samples.
The distribution of As (ppm) is not matching with lithology (Fig. 4) suggesting a mostly anthropogenic origin. Arsenic-rich pesticides and overexploitation of groundwater are the probable anthropogenic sources of As (ppm) in this area. The distribution of Pb and Hg in the sediments also does not match with lithology (Fig. 4) suggesting a mostly anthropogenic origin for these metals. Ongoing intense illegal mining for construction material in this region suggests a predominant anthropogenic origin for Pb and Hg. Emissions from machines and vehicles used in the extraction of construction material and its transportation could be the probable sources of Pb and Hg.
Ecological risk index (∑ERI)
The ERI16 considers the toxicity of all HMs, ERI of a particular metal (i) is calculated by using the following equation:
$${text{ERI}} = {text{Tr}}^{{text{i}}} times {text{Cf}}^{{text{i}}}$$
(2)
where Tri is the biological toxic response factor of metal (i): As = 10, Cr = 2, Cu = 5, Ni = 5, Pb = 5, Zn = 1, Hg = 40)16 and Cfi is the ratio between regional geological background and metal measured from surface sediment concentration. The sum of ERI of individual metals is the potential risk (∑ERI) for the water bodies of the area of investigation and is calculated by using the following equation:
$$sum {text{ERI}} = sum left( {{text{Tr}}^{{text{i}}} times {text{Cf}}^{{text{i}}} } right)$$
(3)
In this study, ∑ERI presented is calculated according to the terminology used by17. The ∑ERI is calculated from the individual ERI of 7 metals of the surface sediments. ∑ERI17 distribution in the study area is calculated from the summation of individual ecological risks16 of Ni, Pb, Cr, Cu, Zn, As, and Hg (Fig. 6a). The individual ERIʹs plots do not give a better toxicity picture of the area. To overcome this problem, a quick and simple method ∑ERI is used for evaluating the level of pollution18. This method classifies the study area into different levels of contamination zones and identifies the high toxic area for necessary actions19. This method despite being developed for lacustrine systems is still widely used by researchers on land pattern contaminations also17,18,19. The model is formulated based on simple algorithms and has an organized structure including the mathematical relationships between the environmental parameters. The ∑ERI is based on the heavy metal chemistry of surface sediments from the surroundings of aquatic systems. Surface sediment sampling and their chemical analysis are easier than water and are more representative of spatial and temporal distribution. The sediment geochemical data provides a high concentration of contaminants with higher stability than water thereby reducing the possibility of errors due to detection limits of the analytical methods applied.
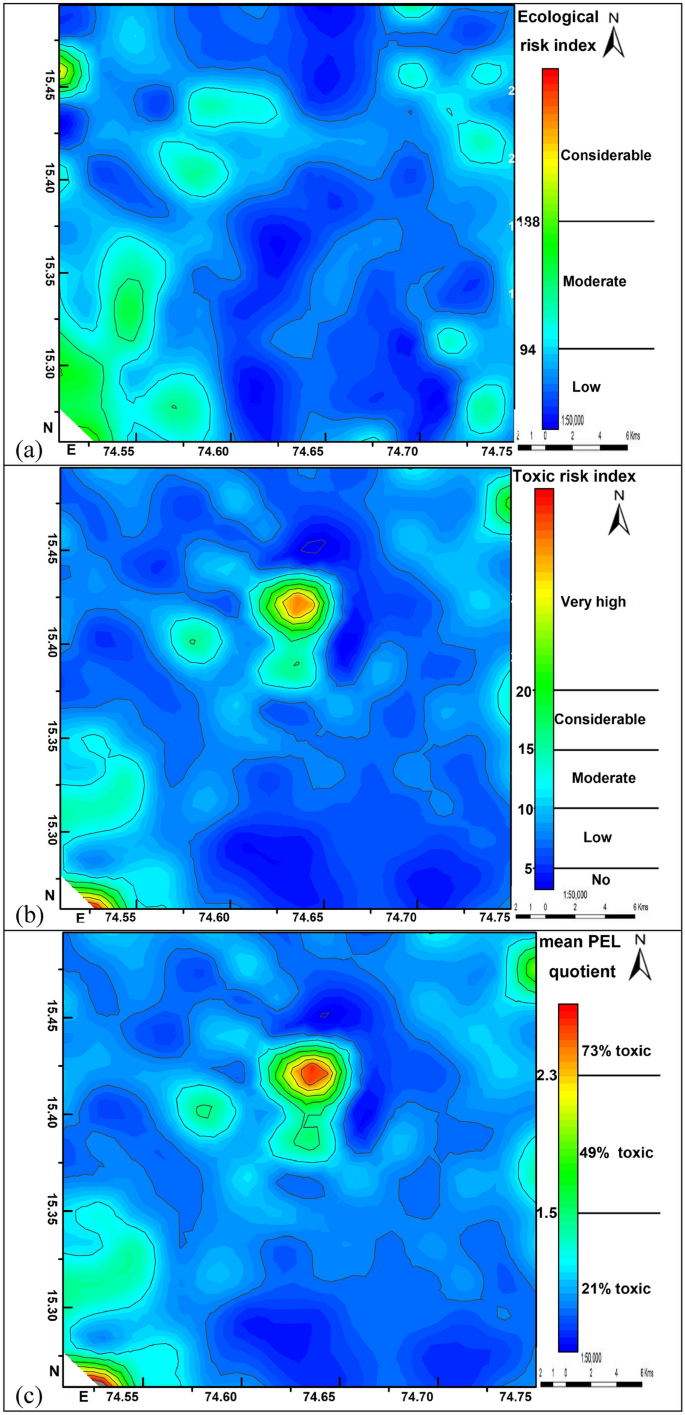
Spatial distribution of potential risks assessed by (a) ecological risk index, (b) toxic risk index, and (c) mean probable-effects-levels quotient methods.
∑ERI is considerable (~ 200) in about 5% of the area, moderate (~ 94–200) in about 35% of the area and is low (~ 38–94) in about 60% of the area. Water bodies (Supa dam reservoir and Kali river) around Ganeshgudi-Jagalbet villages in the south-western part, around Devarayi-Manjarpal villages in the north-western part, and Kakkeri-Alnavar-Mangalvad villages in the north-eastern part of the study area shows a moderate to considerable level of potential ecological risk for the aquatic system and their biota. The dense forest stretch from north to south between Merda-Dandeli villages (Fig. 2) in the middle part of the study area is almost free from human encroachment and anthropogenic activities. The distribution of low ∑ERI values overlaps with this dense forest area. The highest values of ∑ERI around Ganeshgudi village could be due to the Supa dam reservoir-related anthropogenic activities and around Alnavar village could be due to the settlement-related anthropogenic activities such as vehicle emissions, agriculture, construction, and domestic waste. The low-risk zone in the middle dense forest area is habituated by a few tribal villages that live in close harmony with nature.
Toxic risk index (∑TRI)
The TRI20 considers the threshold-effect-level (TEL) and probable-effects-levels (PEL) of metals to assess the biological risks. The individual toxic risk index (TRIi) is calculated by using the following equation:
$${text{TRIi}} = surd ({text{C}}_{{text{s}}}^{{text{i}}} /{text{C}}_{{{text{TEL}}}}^{{text{i}}} )^{2} + ({text{C}}_{{text{s}}}^{{text{i}}} /{text{C}}_{{{text{PEL}}}}^{{text{i}}} )^{2} /2$$
(4)
where Cis is the surface sediment metal concentration, and CiTEL, and CiPEL are the TEL and PEL of the metals respectively. TEL for As = 5.9, Cr = 37.3, Cu = 35.7, Ni = 18, Pb = 35, Zn = 123, Hg = 0.17 and PEL for As = 17, Cr = 90, Cu = 197, Ni = 26, Pb = 91.3, Zn = 315, Hg = 0.486 20. The sum of individual TRIi of metals is the potential toxicity risk index (∑TRI) for the sediments and is calculated by using the following equation:
$$sum {text{TRI}} = left( {{text{TRIi}}1 + {text{TRIi}}2 + ldots {text{TRIi}}7} right)$$
(5)
The toxic units (TUs) of HMs consider only the probable effect level (PEL)21 and ignores the threshold effect level (TEL) to calculate the ecological toxicity. Using only PEL values, this equation underestimates the ecological toxic risk, to overcome this problem20 developed a new toxic risk index (TRI) integrating both TEL and PEL based toxic levels of HMs in the surface sediments and their potential risks to the aquatic organisms (Eq. 4). The individual toxic risk index (TRIi) of metals in this study are significantly variable for Ni (0.81–16.53), Pb (0.23–1.21), Cr (0.94–24.15), Cu (0.20–2.94), Zn (0.10–1.10), As (0.063–4.69) and Hg (0.039–0.45). TRIi in the sediments is below 5 for Pb, Cu, Zn, As and Hg suggesting the absence of any toxic risk, and above 5 for Ni and Cr indicating the presence of toxic risk of these metals to the aquatic life. The ecological toxicity classification based on integrated toxic risk (∑TRI, Eq. 5) values is shown in Fig. 6b, which summarized the toxic risk index to provide a better picture of toxicity risks. The ∑TRI in the study area varies from 3.45-to 38.44, and ~ 60% of the area has ∑TRI < 5 indicating no toxicity, and the remaining ~ 40% of the study area has a low to very high risk of toxicity. Spatially the ∑TRI of the HMʹs is highest in the central (Kudalgaon-Tavargatti-Devarayi region), south-western (Ganeshgudi region), and north-eastern (Kakkeri area) (Fig. 6b). Chromium and Ni are the highest contributors, whereas As, Cu, Pb, Zn, and Hg have the lowest contribution to ∑TRI. Contaminated sediments in high toxic risk areas need to be given more attention due to their high contributing ratios to ∑TRI.
Mean probable-effects-levels quotient (M-PEL-Q)
The M-PEL-Q22 considers the mean probable-effects levels (PEL) to determine the biological effects and potential ecological risk of the HMs. The M-PEL-Q is calculated by using the following equation:
$${text{M – PEL – Q}} = ({text{C}}^{{text{i}}} /{text{PEL}}^{{text{i}}}_{1} + {text{C}}^{{text{i}}} /{text{PEL}}^{{text{i}}}_{2} + ldots {text{C}}^{{text{i}}} /{text{PEL}}^{{text{i}}}_{7} )$$
(6)
where Ci is the surface sediment metal concentration, and PELi1…0.7 are the PEL of the metals discussed respectively, PEL is same as mentioned in Eq. (4).
The quality of topsoil accessed by the mean probable-effects-levels quotient method (M-PEL-Q)22 is a useful tool to decipher the impact of heavy metal pollution on aquatic life23. The M-PEL-Q uses the combined effects of heavy metals (Eq. 6) considering PEL values to calculate the potential biological and ecological risks. The M-PEL-Q values in the study area vary from 0.26–3.5 (Fig. 6c), indicating HMʹs are posing 21–73% toxic effect on the hydrobiota. Spatially ~ 50% of the area is having moderate (21%), ~ 30% of the area is having significant (49%), and ~ 20% of the area is having high (73%) chances of toxicity risk (Fig. 6c). The M-PEL-Q value of < 1.024 is usually considered to be safe and does not require any action to be taken. In this study, M-PEL-Q values for the entire area vary from 0.26 to 3.5, with ~ 60% of the area having an M-PEL-Q value < 1.0 which is under the safe limit. The remaining ~ 40% of the area has an M-PEL-Q value between 1.0–3.5 which is above the safe limit, and can pose moderate to high (21–73%) biological and ecological risks which need urgent action to prevent further deterioration. The M-PEL-Q and ∑TRI20 have similar distribution patterns suggesting that both methods are acceptable tools for the assessment of biological and ecological toxicity risks for sediments, vegetation, aquatic and terrestrial organisms, and human beings.
Based on the results of these four assessment methods, ~ 40% of the surface sediments, water bodies, and the ecology in the Belgaum, Dharwad, and Uttar Kannada districts of Karnataka state India can be described as having moderate to high pollution risk posed by HMs and requires urgent attention of policymakers and the general public from further environmental and human health deterioration. Anthropogenic sources of contamination such as excessive use of pesticides, fertilizers, automobile emissions, and over-exploitation of groundwater need to be reduced. The area with the high potential for biological, hydrological, and environmental risks caused by anthropogenic contamination is mainly concentrated in the north-eastern agriculture belt surrounding the Alnavar village and in the south-western area surrounding Ganeshgudi village near Supa dam reservoir. The rest of the study area is having low to moderate toxic risks and is in the safe zone. Arsenic and Cr are the high-risk toxic elements, Ni is the considerable risk toxic element, and Pb, Cu, Zn, and Hg are the low-risk toxic elements in the study area. Chromium and Ni contamination is broadly contributed by natural processes and Arsenic contamination is mainly contributed by human activities. The ∑TRI and mean probable-effects-levels quotient22 showed a good correlation with each other suggesting that the TRI is an acceptable accurate method for the assessment of ecological toxicity.
Identifying the sources of metals
Multivariate statistical analysis methods of hierarchical cluster analysis (HCA, Fig. 7a) and Pearson’s correlation matrix (PCM, Fig. 7b) are performed to identify the origin, similar behavior, and distribution of HMʹs in the study area. HCA identified five groups (G1-5) of association between seven HMʹs (Fig. 7a) used in this study. G-1 consisting of Ni and Cr, and G-2 consisting of Cu and Zn indicate that these metal groups are derived from similar sources. G-3 consists of Hg, G-4 consists of Pb and G-5 consists of Arsenic suggests that these metal groups are derived from different sources. Probable sources of groups G-1 (Ni = 17 to 346 ppm and Cr = 46 to 1177 ppm) seems to be derived from gneissic rocks and for G-2 (Cu = 10 to 146 ppm and Zn = 17 to 179 ppm) metals from Joldal and PGC Formations due to the similarity in distribution pattern with local geology. G-3 (Hg = 9 to 103 ppb), G-4 (Pb = 11 to 56 ppm), and G-5 (As = 0.5 to 36.9 ppm) are possibly originating from anthropogenic sources as their higher concentrations overlap well with the land-use distribution but do not overlap with the geology of the area. Hg and Pb seem to be originating from atmospheric emissions of automobiles, and agricultural machines. High Arsenic content in sediments of the north-eastern side is consistent with large-scale sugarcane plantation and excessive groundwater pumping for better crop yield. Arsenic-rich pesticides and overexploitation of groundwater are therefore possible sources of Arsenic contamination in the surface sediments. The use of pesticides, fertilizers, and other anthropogenic activities will contribute to the heavy metal pollution in the Belgaum, Dharwad, and Uttar Kannada districts of Karnataka state, but are beyond the scope of the present study. Correlation analysis (PCM) also indicates a similar observation. Ni, Cr, Cu, and Zn showing a strong positive correlation (0.59–0.81) with each other suggests similar geological sources, and a weak correlation with Hg, Pb, As (−0.04–0.26) suggests different sources. Hg, Pb, and As further show a weak correlation (−0.04–0.28) with each other indicating different anthropogenic sources.
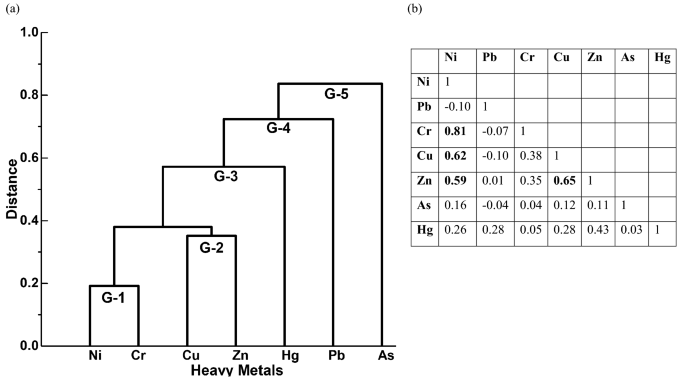
(a) Hierarchical cluster analysis and (b) Pearson’s correlation matrix of selected heavy metals in the surface sediment samples used in this study, bold values indicate strong correlation of metals with each other.