U.S. merchants offer some of the most frictionless user experiences in any country.
Their Global Shopping Index scores are higher than the average of those of six countries, according to “The 2022 Global Digital Shopping Playbook,” a PYMNTS and Cybersource collaboration based on a survey of 3,100 businesses and 13,114 consumers from six countries.
Get the report: The 2022 Global Digital Shopping Playbook
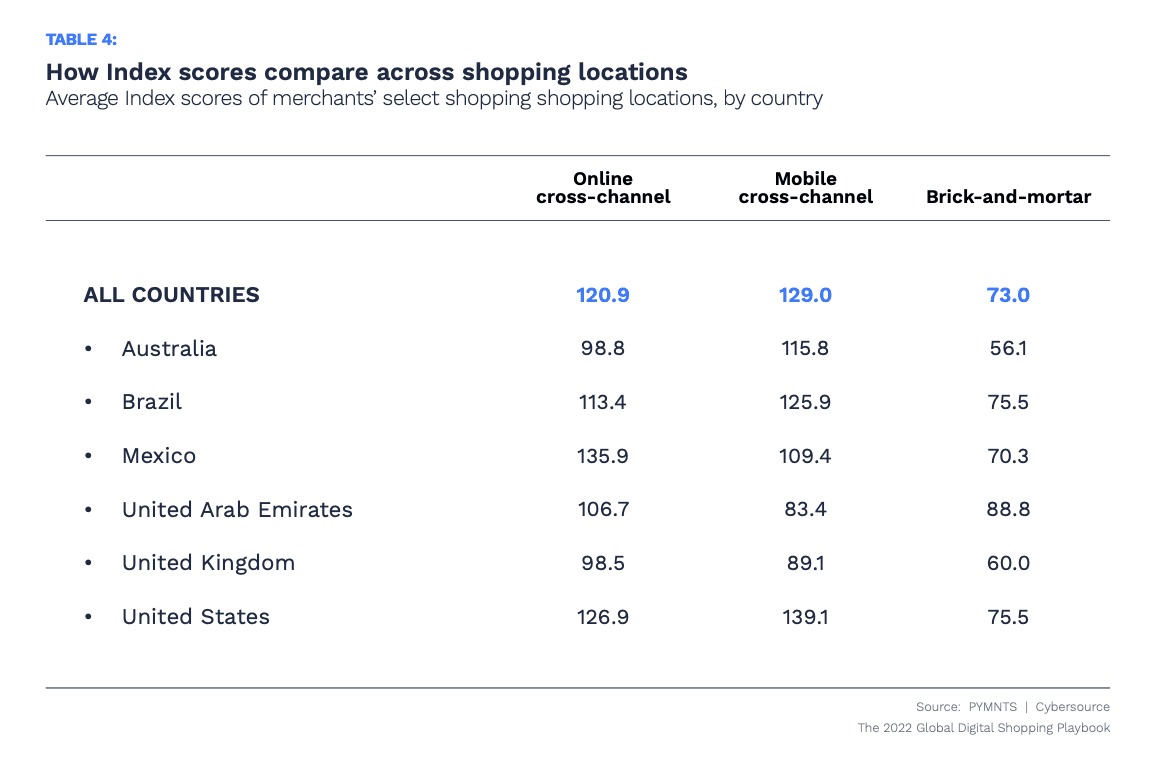
The Global Shopping Index score is a quantitative measurement of how frictionless or friction-laden merchants’ shopping experiences are. Higher Index scores correspond to more seamless shopping experiences.
In one shopping location — online cross-channel shopping — U.S. merchants earn a score that’s six points higher than average, topped only by the score of Mexico.
In mobile cross-channel shopping, U.S. merchants score 10 points higher than average and rank highest among the six countries.
In the third shopping location — brick-and-mortar — U.S. merchants score three points higher than average, with only the United Arab Emirates scoring higher and Brazil scoring the same.

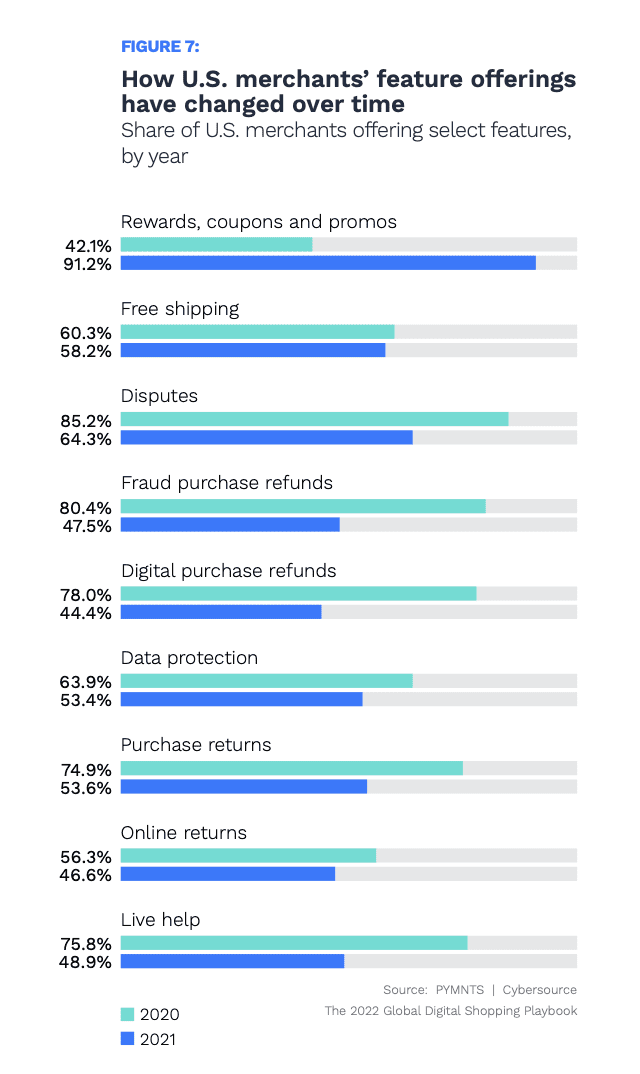
The factors that set U.S. merchants apart from the rest are two promotional incentives that inspire shoppers to click “buy.”
These include rewards, coupons and promos, which are offered by 91% of U.S. merchants, and free shipping, which is offered by 60% of U.S. merchants.

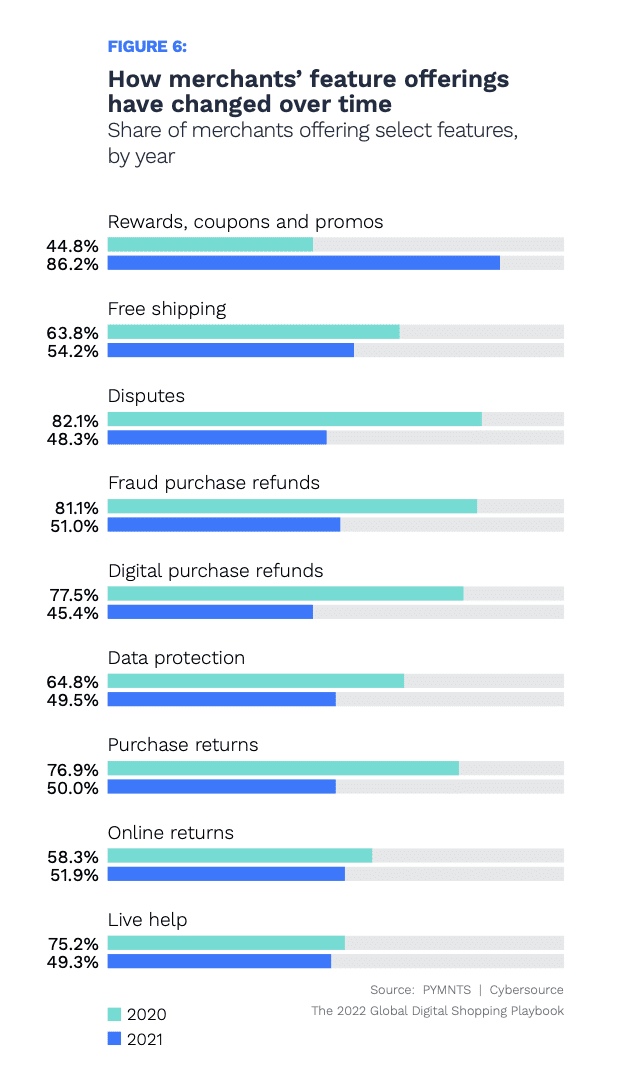
Among all the merchants of the comparable countries PYMNTS studied, 86% offer promotions and 54% provide free shipping options.

U.S. merchants are also far ahead of the rest in providing “protect me” features and practices.
These include offering capabilities that ensure secure data storage and make it easy for shoppers to resolve disputes and return purchases by mail or at the store location.
Among U.S. merchants, 64% make it easy for shoppers to resolve disputes, and 54% make it easy for shoppers to return purchases by mail or at a store location.
Both of those percentages are higher than the shares of merchants on average, which are 48% and 50% respectively.