15.0
Light Vehicle Sales (million SAAR)
1.1%
Chemical Inventories
MACROECONOMY & END-USE MARKETS
Running tab of macro indicators: 15 out of 20

The number of new jobless claims fell by 23,000 to 238,000 during the week ending 29 January. Continuing claims decreased by 44,000 to 1.628 million, and the insured unemployment rate for the week ending 22 January was unchanged at 1.2%.
In a highly-anticipated report, nonfarm payrolls rose by 467,000, well ahead of expectations for a more modest gain. Average hourly wages for production workers continued to accelerate, up 6.9% Y/Y (the gain was 5.7% Y/Y for all workers). While manufacturers added 13,000 jobs, the majority of job gains were in services, including Covid-sensitive sectors like leisure & hospitality and retail sales. The unemployment rate, which comes from the separate household survey, edged higher to 4.0%. The rise in the unemployment rate reflects increased labor force participation which is a good thing. Labor force participation fell sharply during the pandemic and has been slow to recover. The participation rate in January was 62.2%, the highest since March 2020.
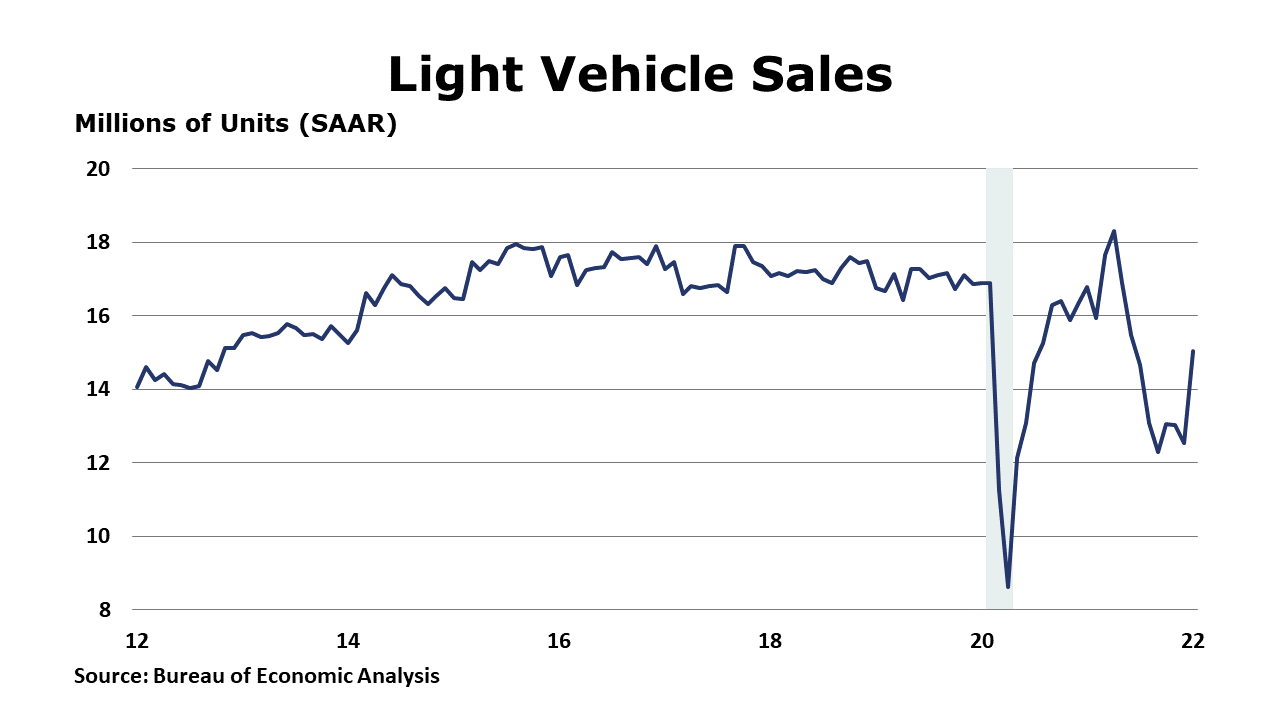
Light vehicle sales rose in January to a 15.0-million-unit seasonally adjusted pace. Sales were up 19.9% from the 12.5-million-unit pace in December. January sales were down 10.4% compared to the same month a year ago. Sales of light trucks rose by a notable 21.8% in January while passenger car sales also rose (by 13.1%).
The Institute for Supply Management’s Services PMI for January continued to show expansion despite supply chain pressures. Expansion was noted in 15 subsectors, with construction, retail trade, and health care leading the way. Only three subsectors reported declines: agriculture, forestry, hunting and fishing; arts, entertainment, and recreation; and information. Compared to December, the level of expansion eased due to supply chain pressures and Covid cases arising from the Omicron variant.
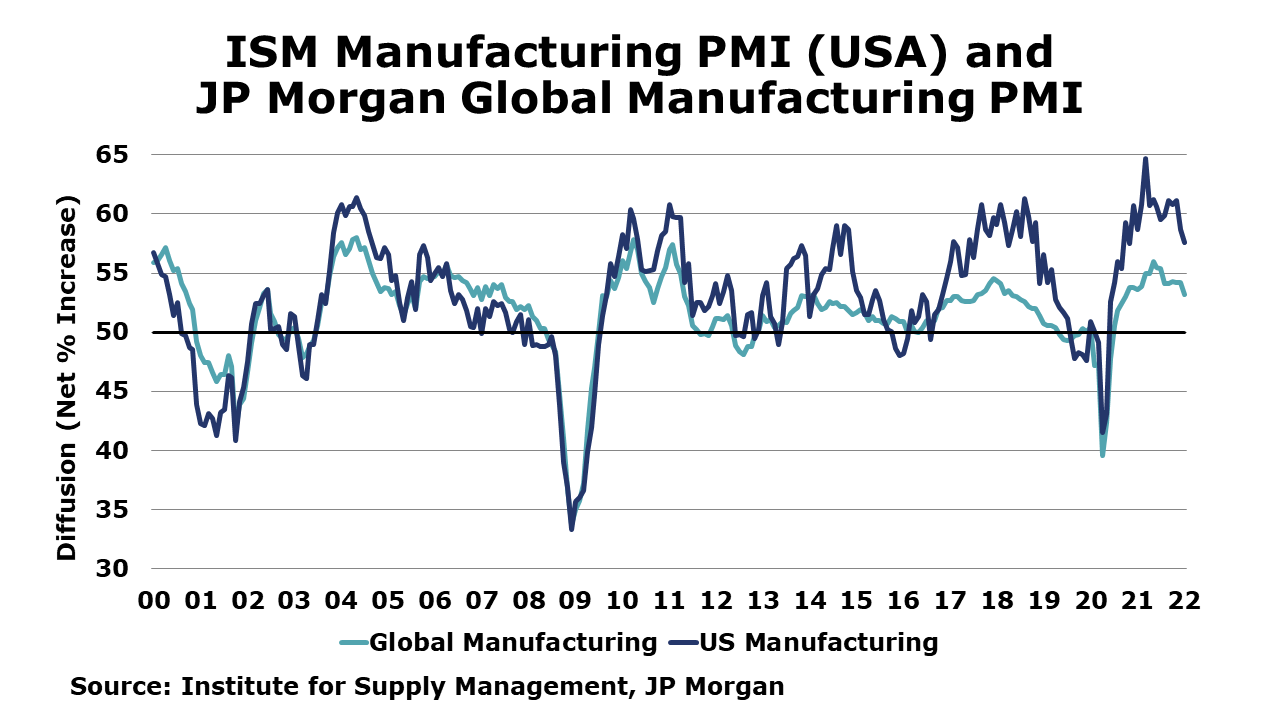
The Institute for Supply Management’s Manufacturing PMI dipped 1.2 points in January. There were declines in the production and new orders components, suggesting that the growth rate of those activities slowed at the beginning of the year, with many respondents commenting on workforce availability and continued supply chain issues. The supplier deliveries component edged lower for a second month suggesting that supply chain bottlenecks are not worsening. Inventories grew at a slower pace and customer inventories were still deemed to be “too low”. Purchasing managers indicated that prices increased at an accelerating rate last month. The report suggests that momentum slowed in the new year as Omicron and persistent supply chain disruptions dampened manufacturing activity. The JPMorgan global manufacturing PMI fell to 53.2 in January, its lowest reading since October 2020, with declines across all major components. Rising Covid numbers, linked to Omicron, disrupted factory activity, resulting in a marked slowing in production growth. New orders growth also slowed, both measures reaching the lowest since the recovery that started in July 2020. Omicron was also a driving factor in worsening labor constraints, with reported staff shortages 5x normal levels in January. Global exports fell, but average supplier delivery times lengthened, indicating that supply chain delays may be easing. Raw materials costs eased, but energy and staffing costs edged up.
Construction spending continued to expand, although at a slower page, up by 0.2% in December. Spending on private residential projects was up 1.1%, led by single-family homes. Spending in nearly every public construction area was compared to the previous month. Compared to a year ago, the value of overall construction spending was up 9.0%.
Factory orders declined in December, down 0.4% from November. The largest gain among major subsectors was in primary metals, up 2.1%. The largest decline was in computers and electronics, down 4.3%. Orders for core business goods were up 0.3% to $79.2B. Manufacturing shipments were up by 0.4% to $529B and inventories also rose by 0.3% to $773B. Compared to a year ago, shipments were up 12% while inventories were up by 9.0% Y/Y. The inventories-to-shipments ratio remained steady at 1.46, compared to the last two months.
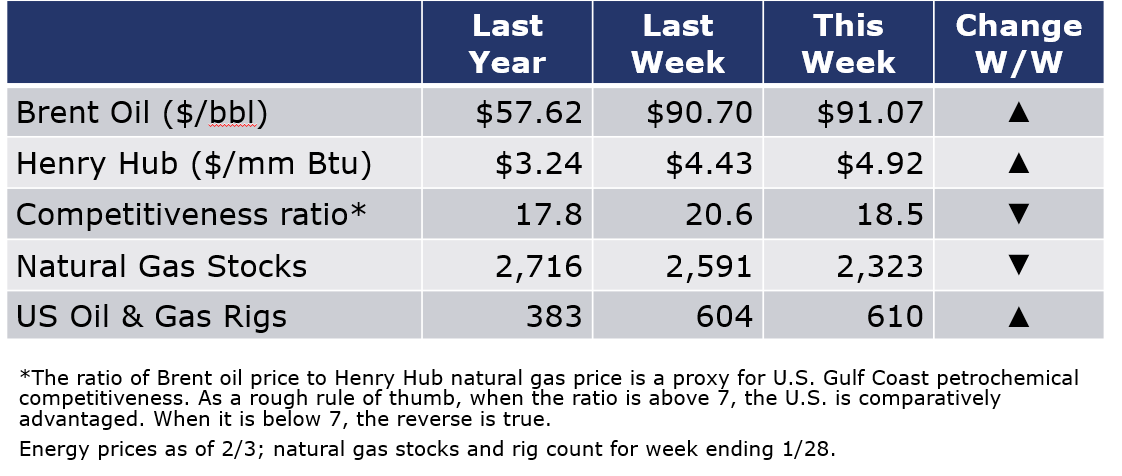
The combined oil and gas rig count rose by six to 610 during the week ending 28 January. Despite an announcement by OPEC+ to move forward with a small planned production increase, oil prices continued to advance. Brent closed above $91 and WTI (the U.S. benchmark) broke the $90 mark for the first time since 2014. Natural gas prices also rose as an Arctic blast chilled large parts of the U.S.
For the business of chemistry, the indicators still bring to mind a green banner for basic and specialty chemicals.
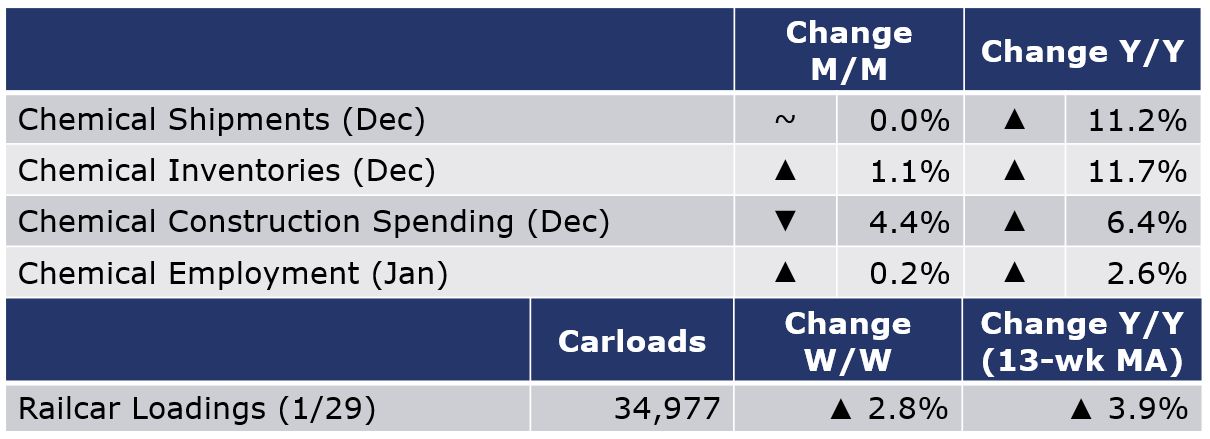
According to data released by the Association of American Railroads, chemical railcar loadings rose by 953 (2.8%) for the week ending 29 January (week 5). Loadings were up 3.9% Y/Y (13-week MA), up slightly (0.8%) YTD/YTD and have been on the rise for seven of the last 13 weeks.
Within the details of the ISM Manufacturing PMI report, the chemical industry was one of 14 industries that grew in January, with growth in new orders, production, and export orders. Supplier deliveries continued to slow and the industry reported higher inventories. Chemical products reported declining employment. Among the comments, “We are experiencing massive interruptions to our production due to supplier Covid-19 problems limiting their manufacturing of key raw (materials) like steel cans and chemicals.”
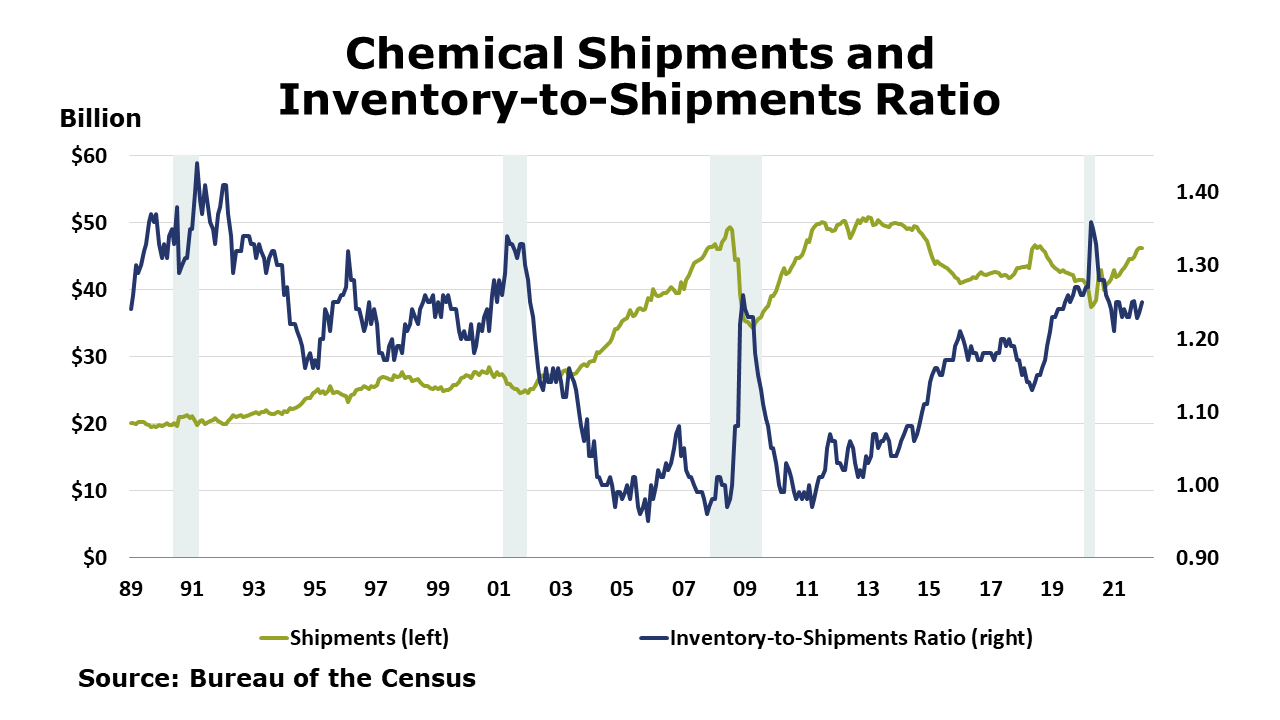
Chemical shipments were essentially flat in December, with gains in agricultural chemicals and all other chemicals offsetting a decline in paints and coatings. Chemical inventories rose 1.1% with gains across all major segments. Compared to a year ago, shipments were up 11.2% Y/Y while inventories were ahead by 11.7% Y/Y. The inventories-to-sales ratio went up to 1.25 from 1.23 in November. This was slightly higher than a ratio of 1.24 last December.
Chemical industry construction spending fell by 4.4% in December to $28.0 billion. Compared to a year ago, spending was up 6.4%.
Chemical industry (including pharma) employment continued to rebound, up by 1,900 (0.2%) in January, following a revised 3,300 gain in December. Compared to last year, employment was ahead by 22,500 (2.6%). In January, there was a 0.6% gain in production workers which was offset by a 0.4% decline in supervisory and non-production workers. At $26.41, average wages were essentially flat compared to last year’s revised average hourly rates. The average workweek edged lower by 36 minutes to 40.7 hours. Combined with the gain in the number of production workers, the total labor input into the chemical industry eased, in contrast with the ISM survey.
Note On the Color Codes
The banner colors represent observations about the current conditions in the overall economy and the business chemistry. For the overall economy we keep a running tab of 20 indicators. The banner color for the macroeconomic section is determined as follows:
Green – 13 or more positives
Yellow – between 8 and 12 positives
Red – 7 or fewer positives
For the chemical industry there are fewer indicators available. As a result we rely upon judgment whether production in the industry (defined as chemicals excluding pharmaceuticals) has increased or decreased three consecutive months.
For More Information
ACC members can access additional data, economic analyses, presentations, outlooks, and weekly economic updates through MemberExchange.
In addition to this weekly report, ACC offers numerous other economic data that cover worldwide production, trade, shipments, inventories, price indices, energy, employment, investment, R&D, EH&S, financial performance measures, macroeconomic data, plus much more. To order, visit https://store.americanchemistry.com/.
Every effort has been made in the preparation of this weekly report to provide the best available information and analysis. However, neither the American Chemistry Council, nor any of its employees, agents or other assigns makes any warranty, expressed or implied, or assumes any liability or responsibility for any use, or the results of such use, of any information or data disclosed in this material.
Contact us at [email protected]