ResOpsUS is the first multi-agency, standardized, national dataset of historical reservoir observations across CONUS23. The dataset contains data for 679 dams in United States and 9 dams in Canada. Figure 2a maps the locations of the ResOpsUS reservoirs compared to all of the large reservoirs in the GRanD database. ResOpsUS covers observations for 87% of the 153 reservoirs in the US with storage capacities greater than 1000 MCM and 34% of the total storage of large dams with storage capacities greater than 10 MCM in the US. 653 of the reservoirs in ResOpsUS include daily storage records, 519 dams have daily outflow records, 321 have daily inflow records, 506 dams have daily elevation records, and 46 dams have daily evaporation estimates.
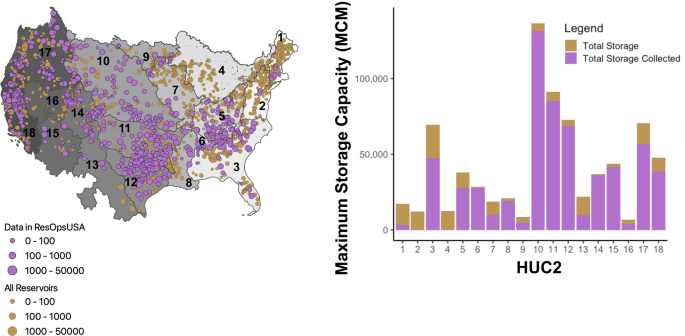
(a) Map of data coverage for the ResOpUS dataset (purple) compared to all of the large dams in the GRanD database (brown). All dams are scaled by size (maximum storage capacity in million cubic meters (MCM)) to demonstrate that ResOpUS contains the majority of dams greater than 1,000 MCM. (Note that the threshold for large dams in GRanD is dams higher than 15 meters or with storage >10 MCM, therefore there are some smaller storage dams in this map. However, this is not including all of the smaller storage structures which are not included in GRanD). (b) Data completeness per variable for all the dams in ResOpsUS the amount of total storage covered per HUC2 in million cubic meters (MCM). HUC1 HUC6 sit in the Eastern US HUC7 – HUC12 encompass the Midwestern US, and HUC13 – HUC18 encompass the Western US.
Figure 2b, shows the relative coverage by storage volume aggregated by HUC2 in million cubic meters (MCM). The HUC2s with the largest amount of storage (3, 5, 6, 8, 10, 11, 12, 14, 15, 16, 17, 18) all have over 50% of their storage covered in ResOpsUS. The HUC2s regions that are lacking storage coverage (2 and 4) correspond to the least amount of storage in CONUS, and are less likely to hold large dams (storage capacity greater than 1,000 MCM). Additionally, regions 2 and 4 have 288 (MCM) and 365 (MCM) total storage covered, so while they are lacking in data, they are not completely empty.
Spatial trends in coverage reflect trends in reservoir size across the US (Fig. 2a). The western U.S. generally has better coverage than the Northeast and Midwest. These regions generally have less coverage because many of the dams are smaller. Smaller dams are more likely to be included in the dataset when they are managed by federal agencies such as the Bureau of Reclamation (BOR) or the Army Corps of Engineers (ACE) (Fig. 1). Small dams that are independently operated (as is more common in these areas) are not covered in this dataset because we focused on gathering data for large dams. The large number of dam operators in the Great Lakes Region (HUC4) and the Eastern United States (HUC2) combined with the fact that most reservoirs are less than 25,000 MCM in these regions contributed to the lack of data acquired.
In all cases the total period of record for a reservoir was requested; however, in some cases the data were limited to the most recent years of operations. In some cases earlier operations were not available electronically, or there were gaps in the middle of the record due to data collection issues. We accepted available data even if the complete period of record was not covered and in these cases gaps are denoted by “NA” values in the dataset. Our observations have an average starting year of 1974 and an average ending year of 2020, which corresponds to approximately 40 years of data. There are also differences in the variables provided by each dam operator. Here too, we accepted all variables that were available and do not limit ourselves to only those dams featuring data for all variables. Figure 3 depicts the completeness of each requested variable in the database by variable. Storage and release have the best coverage, each with over 400 dams (Fig. 3, panels a and c). Inflow (Fig. 3, panel b) follows closely behind with 300 dams, but is lacking entirely in 47% of cases. When available, evaporation and elevation were added to the dataset, but these variables were not available as often (Fig. 3, panels d and e). In most cases either elevation or storage were provide. Storage was provided for almost all the dams. Evaporation data were generally only provided for reservoirs in the Bureau of Reclamation dataset(Fig. 3, panel e).

Data completeness histogram for ResOpsUS. All panels have number of records on the y axis and have been binned by percent completed for data starting at 1980 and ending in 2020. Panel a corresponds to storage. Panel b corresponds to inflow. Panel c corresponds to outflow. Panel d corresponds to elevation. Panel e corresponds to evaporation.
This organized database, as depicted in Fig. 4, contains four main folders: attributes, time_series_all, raw_time_series, and time_series_single_variable-table. The time_series_all folder contains individual CSV files for each dam that contain all the direct observations. All dams are organized using a unique ID (Dam_ID) that matches the GRanD dam id (Lehner et al., 2011). All time series files are organized by Dam_ID. In cases where we had data for one dam from multiple agencies, we chose the data with the most complete and longest period of record in the main time series folder. The duplicate files are located in raw_time_series folder labeled with the Dam_ID and Agency_ID. For instances where the data was not sourced online, JCS is listed to note where files were gathered via survey. We have also included single variable tables for storage, inflow and outflow with columns for all the Dam_IDs. The attributes folder provides information on the agencies that provided data for each dam (agency_attributes), the reservoir characteristics (i.e. dam height, location, storage capacity all in the reservoir_attributes) as well as an inventory of all the available time series data and date ranges (timeseries_inventory). Consistent variable names and units were used throughout the dataset and are described in the time_series_variables.
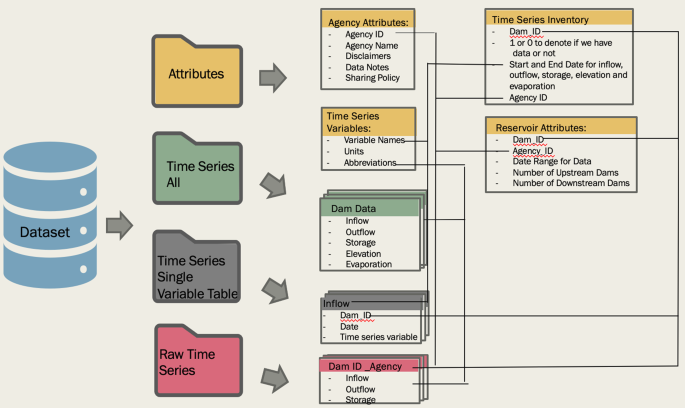
Schematic of the organized ResOpsUS dataset.
All data files are hosted on Zenodo. This repository is open access, and the review process for the stable DOI ensures that the data is in a reusable and consistent format. The stable DOI for ResOpsUSv1.1 is https://doi.org/10.5281/zenodo.589364123.